Download
1 / 29
290 likes | 577 Views
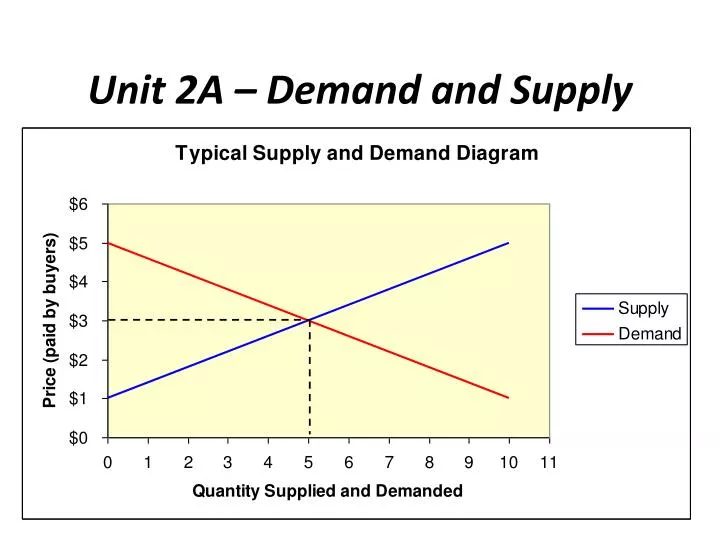
Unit 2A – Demand and Supply. Part 1 - Demand. 1. What is a market? Provide 4 examples of markets. 2. What is demand? What is a demand schedule? What is a demand curve? 3. Explain the “law of demand.”

E N D
Part 1 - Demand 1. What is a market? Provide 4 examples of markets. 2. What is demand? What is a demand schedule? What is a demand curve? 3. Explain the “law of demand.” 4. How do the law of diminishing marginal utility, the income effect, and the substitution effect all explain the relationship between price and quantity demanded? (Explain each separately.) 5. How is the market demand for a product related to an individual’s demand for that product? 6. What factors can cause a change in demand? (List each.) 7. What is the difference between “normal” goods and “inferior” goods? 8. Explain the difference between demand and quantity demanded. What is the only factor that can cause a change in quantity demanded?
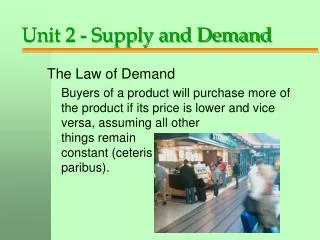
Part 1 - Demand Key Points: 1. In this unit, we’re looking at competitive markets, where neither individual sellers nor buyers have the ability to set prices. Prices are determined “by the market.” 2. Demand – the quantities of a product or service that consumers are willing and able to buy at various prices during a particular period. 3. The demand curve is a graph of this data for a particular good. It is almost always downward sloping.
What happens to demand when price changes? Careful. NOTHING! Quantity demandedchanges with price, not demand. P • D 0 • Q
What factors can change demand, i.e. shift the demand curve? P • D 0 • Q
To show a change in demand, simply draw and label a new demand curve. P • D 0 • Q
To show a change in demand, simply draw and label a new demand curve. What could have caused this demand curve to shift to the right? P • D2 • D1 0 • Q
To show a change in demand, simply draw and label a new demand curve. What could have caused this demand curve to shift to the left? P • D2 • D1 0 • Q
Draw a correctly labeled graph of demand for coffee. P • D 0 Coffee • Q
Starbucks creates a new mocchiolattatocre’me’ coffee drink that everyone loves. P • D1 • D2 0 Coffee • Q
The price of cream goes up significantly. P • D2 • D1 0 Coffee • Q
The price of tea goes down significantly. P • D2 • D1 0 Coffee • Q
Income in the U.S. rises by 8% in 2013. P • D1 • D2 0 Coffee • Q
Doctors publish a new report that drinking coffee can help prevent some forms of cancer. P • D1 • D2 0 Coffee • Q
Draw a correctly labeled graph of demand for solar panels. P • D 0 Solar Panels • Q
Development of Marcellus shale gas drives the price of natural gas down . P • D2 • D1 0 Solar Panels • Q
Political turmoil in the Middle East drives the price of heating oil up. P • D1 • D2 0 Solar Panels • Q
The government announces that, beginning on January 1, 2015, it will begin offering a major tax break for installing solar panels. Draw the short run effect on demand. P • D2 • D1 0 Solar Panels • Q
Draw a correctly labeled graph of demand for Raman noodles. P • D 0 Raman Noodles • Q
Income among college students rises by 20%. Note: Raman noodles are famous for being something people eat a lot of when they can’t afford anything else, so they are an inferior good. P • D2 • D1 0 Raman Noodles • Q
Homework: Read Chapter 3, Pages 45 – 52. (Stop at “Applications: Govt. Set Prices”). Answer study questions 2 - 8.
Now let’s add supply, and establish market equilibrium. If demand goes up (shifts right), what happens to price and quantity? P2 P1 D2 • D Q1 Q2
If demand goes down, what happens to price and quantity? P S P1 P2 D D2 0 Q2 Q1 • Q
If demand goes up, what happens to price and quantity? P S P2 P1 D D2 0 Q1 Q2 • Q
If supply goes down, what happens to price and quantity? S2 P S P2 P1 D 0 Q2 Q1 • Q
If supply goes up, what happens to price and quantity? P S2 S P1 P2 D 0 Q1 Q2 • Q
It depends. Let’s look: Supply Goes Up & Demand Goes Down. What if both change at the same time? P S2 S Supply goes up means: P↓ and Q↑ Demand goes down means: P↓ and Q↓. P1 P2 D D2 0 Q1 Q2 • Q
Homework: Read Ch. 3 Pages 52-56 in textbook. Do Study Questions 11, 13, & 14. Read Ch. 3 Web (handout) from page 7 – end. Start from “Producer and Consumer Surplus” Do Study Questions 1, 2, 3, 5, 6, 8, 13, 16