Download
1 / 57
570 likes | 798 Views
The Market System. Partial Equilibrium Analysis: Supply and Demand. Specific Objectives. Forecast changes in equilibrium price and quantity for a given change in a non-price determinant of demand or supply. An Application of Market Demand and Supply: Exchange Rate Markets

E N D
The Market System Partial Equilibrium Analysis: Supply and Demand
Specific Objectives • Forecast changes in equilibrium price and quantity for a given change in a non-price determinant of demand or supply. • An Application of Market Demand and Supply: Exchange Rate Markets • Using the model of market demand and supply explain how exchange rates are determined. • Explain the difference between currency appreciation and currency depreciation and determine if the dollar has appreciated or depreciated relative to a foreign currency. • Determine the impact of changes in exchange rates on international trade.
Demand • A relation showing how much of a good consumers are willing and able to buy at each possible price during a given period of time, other things held constant
Candy Bar Auction • Write the amount you are willing and able spend now, for this candy bar.
The Law of Demand • The quantity of a good demanded is inversely related to its price, other things constant • The law of demand can be explained by the substitution effect and the income effect • Substitution effect—When the price of a good falls, consumers will substitute it for other goods • Income effect—A fall in price increases consumers’ real income
The Demand Schedule and the Demand Curve The demand curve slopes downward because of the law of demand
Changes in Quantity Demanded P D decrease in quantity demanded increase in quantity demanded Q
Changes in Demand (Determinants of Demand) • Changes in demand can be caused by changes in- • Consumer Income (flow) • Change in Wealth (stock) • The prices of related goods • Consumer expectations • The number of consumers in the market • Consumer tastes and preferences
Changes in Income:Normal and Inferior Goods • A normal good is a good for which demand increases as consumer income rises • An inferior good is a good for which demand decreases as consumer income rises
The Price of Related Goods:Substitutes and Complements • Substitutes are goods that are related in such a way that in increase in the price of one good leads to an increase in demand for the other good • Complements are goods that are related in such a way that an increase in the price of one leads to a decrease in the demand for the other
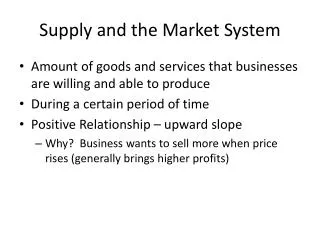
Supply • A relation showing how much of a good producers are willing and able to sell at each possible price during a given period of time, other things held constant
The Law of Supply • The quantity of a good supplied is directly related to its price, other things constant
The Supply Schedule and the Supply Curve The supply curve slopes upward because of the law of supply
Changes in Quantity Supplied (Increases and Decreases) P decrease in quantity supplied S increase in quantity supplied Q
Changes in Supply • Changes in supply can be caused by changes in, • Technology • The prices of resources used in production • The prices of alternative goods (related outputs) • Producer expectations • The number of producers
Increase in Supply P S S’ Q
Decrease in Supply P S’ S Q
Market equilibrium In equilibrium, the plans of buyers match the plans of sellers P D S Pe Qe Q
Equilibrium and Changes in Demand D’ P D S P’e Pe Qe Q’e Q
Equilibrium and Changes in Supply P D S S’ Pe P’e Qe Q’e Q
Part I Equilibrium Determination For each question identify what happens to price and quantity in equilibrium. 1. What happens in the diet pill market, if a study demonstrates conclusively that ephedrine increases the risk of heart attacks? 2. What happens to the market for Cocaine when the DEA dramatically increases its campaign against growers in Columbia? 3. What happens in the market for jelly if the peanut crop is experiences massive loss due to disease? 4. In 1992, new regulations in food labeling forced producers to have their information verified by an independent lab. The verification process can cost as much as $20,000 per item. What impact would this have on the price and quantity of food subject to this regulation?
Real World Check • We do not observe supply and demand curves, we only observe selling prices and quantities, at different times.
Price Floors and Ceilings • A price floor is a minimum legal price below which a good or service cannot be sold • examples: minimum wage, agricultural products • A price ceiling is a maximum legal price above which a good or service cannot be sold • examples: rent controls, usury laws, organ donation
A Price Floor Above Equilibrium Price P D surplus S Q
Examples of Price Floors • Minimum Wage • Farm Support (Milk)
A Price Ceiling Below Equilibrium Price P D S shortage Q
Examples of Price Ceilings • Usury Laws (Max interest rates) • Rent controls • Cabbage Patch Kids, Tickle Me Elmo, Beanie Babies, Pok e Mon, Xbox 360 • Dave Matthews Band Tickets • Organ donation • http://www.healthpolitics.com/media/prog_48/slides_prog_48.pdf
Elasticity • Elasticity is a general concept that can be used to quantify the response in one variable when another variable changes.
When demand does not respond at all to a change in price, demand is perfectly inelastic. Demand is perfectly elastic when quantity demanded drops to zero at the slightest increase in price. Perfectly Elastic andPerfectly Inelastic Demand Curves
Elasticity and the War on Drugs • Can we win the War on drugs? • Is the war on the demand or supply? • How does elasticity help us understand the War?
Gas Prices • What is Price Gouging? • Why do prices change so frequently? • Short run elasticity -0.11 to -0.25 for demand and 0.75 for supply. • Solutions to high prices.
Exchange Rate • The price of one country’s currency measured in terms of another country’s currency • ex. $/Pound or Pound/$
Why do people want Foreign Currency? • The want to buy foreign goods • They want to buy foreign financial assets • The want to speculate
Actors in the Foreign Exchange Market • Hedgers (Traders) • Arbitrageur • Speculators • Central Bankers
The Foreign Exchange Market Exchange rate Peso/$ D S Supply of Dollars by people who want pesos Demand for Dollars by people who have pesos Foreign exchange (dollars)
Currency Depreciation and Appreciation • Currency depreciation is an increase in the number of units of a particular currency needed to purchase one unit of foreign exchange • Currency appreciation is a decrease in the number of units of a particular currency needed to purchase one unit of foreign exchange
Changes in the Equilibrium Exchange Rate Supply of Dollars by people who want pesos Exchange rate Peso/$ D S S’ $ -depreciation Peso- appreciation Demand for Dollars by people who have pesos Foreign exchange (dollars)
Purchasing Power Parity • The purchasing power parity theory predicts that exchange rates between two national currencies will adjust in the long run to reflect price-level differences in the two countries • example: If a bike cost $100 in US, and 300pesos in Mexico, PPP predicts that the Peso/$ exchange = 3. If not arbitrage would be profitable (buy bikes in Mexico and sell in US)
Why does PPP Fail? • Non-Traded goods • Tariffs and Quotas • Productivity differentials • People demand foreign currency for reasons other then to buy traded goods
Exchange Rate Regimes • Flexible (Floating) exchange rates. • Fixed exchange rates. • Currency Board • Monetary Union • Managed Float (Dirty Float) exchange rates.
The Central Bank Can Intervene to Maintain Exchange Rates Exchange rate $/pound D’’ S D’ Foreign exchange (pounds)
Currency Crisis D’ Exchange rate Baht/$ D S 52 25 Foreign exchange ($)
Problems • Foreigners can’t make their dollar denominated debt payments • Can’t afford foreign goods • Shopping opportunities
Currency Unions • Currency Unions are the adoptions of a single currency among several countries • European Union - currency (Euro) • The United States - currency (Dollar)