Download
1 / 15
160 likes | 451 Views
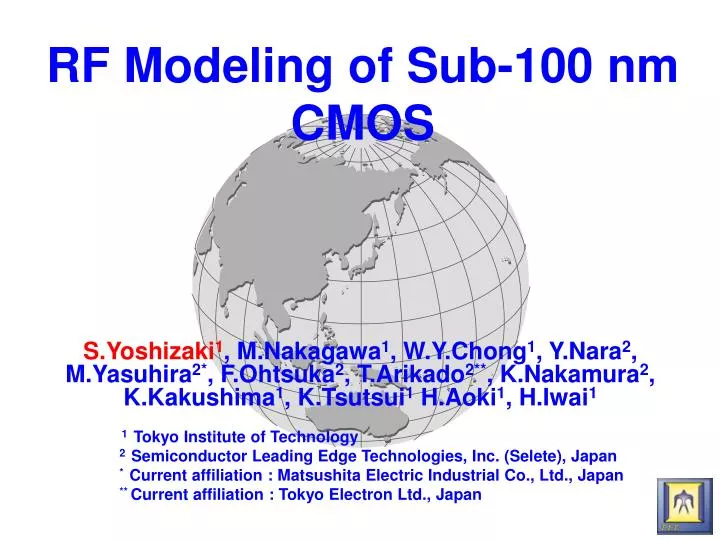
RF Modeling of Sub-100 nm CMOS. S.Yoshizaki 1 , M.Nakagawa 1 , W.Y.Chong 1 , Y.Nara 2 , M.Yasuhira 2* , F.Ohtsuka 2 , T.Arikado 2** , K.Nakamura 2 , K.Kakushima 1 , K.Tsutsui 1 H.Aoki 1 , H.Iwai 1 1 Tokyo Institute of Technology

E N D
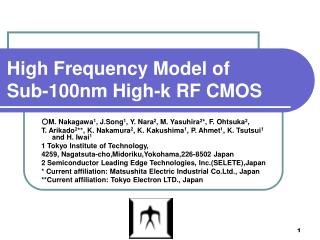
RF Modeling of Sub-100 nm CMOS S.Yoshizaki1, M.Nakagawa1, W.Y.Chong1, Y.Nara2, M.Yasuhira2*, F.Ohtsuka2, T.Arikado2**, K.Nakamura2, K.Kakushima1, K.Tsutsui1 H.Aoki1, H.Iwai1 1 Tokyo Institute of Technology 2 Semiconductor Leading Edge Technologies, Inc. (Selete), Japan * Current affiliation : Matsushita Electric Industrial Co., Ltd., Japan ** Current affiliation : Tokyo Electron Ltd., Japan
Background ~RF Technology~ • Spread of the cellular phone and the wireless LAN. • The age of Digital information appliances • RF technologies serve the rapidly growing wireless communication markets. Fig.1 4-th Generation mobile • Center Research Laboratory, Hitachi Ltd. Accurate RF Modeling become important to more than before. But … In RF, some parasitic elements effect more severe. Fig.2 Technology-development cost reduction (due to TCAD) • ITRS2004update, 2004
Feature in RFCMOS Merit Demerit • Low cost compared with compound semiconductors • Consolidation with logic circuits Low operation voltage with scaling SN ratio degradation ScalingandCircuit technologies improve fT and fmax Fig.3 Application Spectrum • ITRS2004, 2004
The concern about High-k MOSFET in RF ① Degradation of dielectric constant with dielectric relaxation. ② RF characteristic deterioration with degrading mobility. ③ Increase interface state density → Increase Low-frequency noise and thus Phase noise.
RF Modeling of Sub-100 nm High-k MOSFET Motivation • There are little reports about RF performance evaluation and modeling with High-k MOSFETs. • Comparison HfSiON with SiON.
silicide HfSiON SiN Si Fig.4 HfSiON MOSFET structure M1 G G G G G VIA1 STI S D S D S 63.9nm 61.7nm 62.3nm 65.5nm 65.3nm Device • EOT = 1.5nm (HfSiON & SiON) • Gate length HfSiON (Lg= 64nm), SiON (Lg= 51nm) • The number of finger = 12(W=5μm) silicide SiON SiN Si Fig.5 SiON MOSFET structure Increase gate width with increasing number of fingers, the gate resistance become small. Nf : The number of finger Fig.6 Section of HfSiON MOSFET
Measured Simulated DC Measurement and Simulation 【HfSiON】 Vgs=0, 0.6, 0.9, 1.2, 1.5V Fig.7 Measured and simulated Ids-Vds 【HfSiON】 Fig.8 Measured Ids-Vds 【SiON】
To de-embed parasitic elements including wires and pads is important that could obtain the real device parameters. De-embedding Cgd Rgdp OPEN Drain Gate Drain Ld Rd Gate Cd Lg Rg BSIM4 Cg Rs Rdp Rgp Ls DUT SHORT Drain Gate
Measured GAmax Simulated GAmax Measured H21 Simulated H21 Measured and Simulated fT, fmax 【HfSiON】 Vg=1.2V, Vd=1.5V fT,HfSiON = 189.9[GHz] fmax,HfSiON = 59.9[GHz] LD RD CGD Fig.9 H21 and GAmax vs. Frequency 【HfSiON】 Rg BSIM4 CGS Fig.10 Equivalent circuit model
Measured GAmax Extrapolated GAmax Measured H21 Extrapolated H21 Measured S-parameter and Predicted fT, fmax 【SiON】 Vg=1.2V, Vd=1.5V fT,SiON = 236[GHz] fmax,SiON = 74[GHz] Fig.11 H21 and GAmax vs. Frequency 【SiON】
Cross SiON and HfSiON characteristics gm peak RF Characterization~ fT & gm Comparison HfSiON with SiON~ Fig.12 fT and gm vs. Id
SiON HfSiON Position of this device Gate Length [um] Gate Length [um] • Fig.13 fT and fmax • IEDM, VLSI 1995~2004
Summary • We measured and simulated High-k MOSFET RF characteristics. • Measured from 500MHz to 40GHz, there is no dielectric relaxation. • Simulated fT and fmax in HfSiON, we obtained good fT (189.9GHz) relatively. • SiON is expected much more high performance than HfSiON. I guess this is because of mobility degradation. Acknowledgement This work was partially supported by Special Coordination Funds for Promoting Science and Technology by Ministry of Education, Culture, Sports, Science and Technology, Japan.
Appendix A~Flicker noise~ Id=1mA / Vd=0.1V Fig.14 Flicker noise
Appendix B~RF CMOS Evaluation Equipment~ 8 inch wafer, 40 GHz


![Fraction of particles < 100 nm [wt%]](https://cdn3.slideserve.com/5518027/slide1-dt.jpg)