Download
1 / 1
10 likes | 106 Views
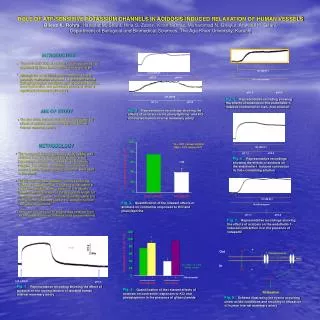
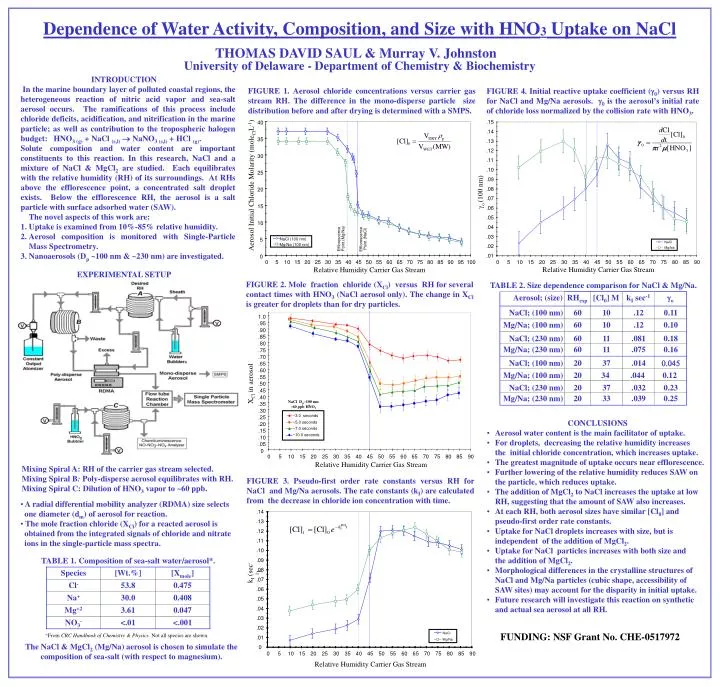
Dependence of Water Activity, Composition, and Size with HNO 3 Uptake on NaCl. THOMAS DAVID SAUL & Murray V. Johnston. University of Delaware - Department of Chemistry & Biochemistry. INTRODUCTION

E N D
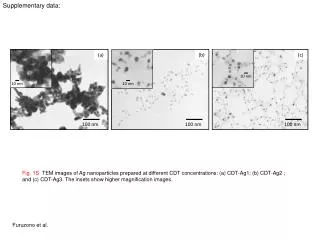
Dependence of Water Activity, Composition, and Size with HNO3 Uptake on NaCl THOMAS DAVID SAUL & Murray V. Johnston University of Delaware - Department of Chemistry & Biochemistry • INTRODUCTION • In the marine boundary layer of polluted coastal regions, the heterogeneous reaction of nitric acid vapor and sea-salt aerosol occurs. The ramifications of this process include chloride deficits, acidification, and nitrification in the marine particle; as well as contribution to the tropospheric halogen budget: HNO3 (g) + NaCl (s,l) NaNO3 (s,l) + HCl (g). • Solute composition and water content are important constituents to this reaction. In this research, NaCl and a mixture of NaCl & MgCl2 are studied. Each equilibrates with the relative humidity (RH) of its surroundings. At RHs above the efflorescence point, a concentrated salt droplet exists. Below the efflorescence RH, the aerosol is a salt particle with surface adsorbed water (SAW). • The novel aspects of this work are: • Uptake is examined from 10%-85% relative humidity. • Aerosol composition is monitored with Single-Particle Mass Spectrometry. • Nanoaerosols (Dp ~100 nm & ~230 nm) are investigated. FIGURE 1. Aerosol chloride concentrations versus carrier gas stream RH. The difference in the mono-disperse particle size distribution before and after drying is determined with a SMPS. FIGURE 4. Initial reactive uptake coefficient (0) versus RH for NaCl and Mg/Na aerosols. g0 is the aerosol’s initial rate of chloride loss normalized by the collision rate with HNO3. 40 .15 .14 35 .13 .12 30 .11 25 .10 .09 Aerosol Initial Chloride Molarity (moleClL-1) 20 go (100 nm) .08 .07 15 .06 .05 10 .04 .03 Efflorescence Efflorescence Point (NaCl) Point (Mg/Na) NaCl (100 nm) 5 Mg/Na (100 nm) NaCl .02 Mg/Na 0 .01 0 5 10 15 20 25 30 35 40 45 50 55 60 65 70 75 80 85 90 95 100 0 5 10 15 20 25 30 35 40 45 50 55 60 65 70 75 80 85 90 Relative Humidity Carrier Gas Stream Relative Humidity Carrier Gas Stream EXPERIMENTAL SETUP FIGURE 2. Mole fraction chloride (XCl) versus RH for several contact times with HNO3 (NaCl aerosol only). The change in XCl is greater for droplets than for dry particles. TABLE 2. Size dependence comparison for NaCl & Mg/Na. Aerosol; (size) RHexp [Cl0] M kI sec-1 go NaCl; (100 nm) 20 37 .014 0.045 NaCl; (230 nm) 20 37 .032 0.23 Mg/Na; (100 nm) 20 34 .044 0.12 Mg/Na; (230 nm) 20 33 .039 0.25 NaCl; (100 nm) 60 10 .12 0.11 XCl in aerosol NaCl; (230 nm) 60 11 .081 0.18 NaCl Dp~100 nm ~60 ppb HNO3 Mg/Na; (100 nm) 60 10 .12 0.10 Mg/Na; (230 nm) 60 11 .075 0.16 ~3.0 seconds • CONCLUSIONS • Aerosol water content is the main facilitator of uptake. • For droplets, decreasing the relative humidity increases • the initial chloride concentration, which increases uptake. • The greatest magnitude of uptake occurs near efflorescence. • Further lowering of the relative humidity reduces SAW on the particle, which reduces uptake. • The addition of MgCl2 to NaCl increases the uptake at low • RH, suggesting that the amount of SAW also increases. • At each RH, both aerosol sizes have similar [Cl0] and • pseudo-first order rate constants. • Uptake for NaCl droplets increases with size, but is independent of the addition of MgCl2. • Uptake for NaCl particles increases with both size and • the addition of MgCl2. • Morphological differences in the crystalline structures of NaCl and Mg/Na particles (cubic shape, accessibility of • SAW sites) may account for the disparity in initial uptake. • Future research will investigate this reaction on synthetic and actual sea aerosol at all RH. ~5.0 seconds ~7.0 seconds ~10.0 seconds 0 5 10 15 20 25 30 35 40 45 50 55 60 65 70 75 80 85 90 Relative Humidity Carrier Gas Stream Mixing Spiral A: RH of the carrier gas stream selected. Mixing Spiral B: Poly-disperse aerosol equilibrates with RH. Mixing Spiral C: Dilution of HNO3 vapor to ~60 ppb. FIGURE 3. Pseudo-first order rate constants versus RH for NaCl and Mg/Na aerosols. The rate constants (kI) are calculated from the decrease in chloride ion concentration with time. 1.0 • A radial differential mobility analyzer (RDMA) size selects • one diameter (dm) of aerosol for reaction. • The mole fraction chloride (XCl) for a reacted aerosol is • obtained from the integrated signals of chloride and nitrate • ions in the single-particle mass spectra. .95 .14 .90 .85 .13 .80 .12 .75 .11 .70 .65 .10 .60 .09 TABLE 1. Composition of sea-salt water/aerosol*. .55 .08 .50 kI (sec-1) Species [Wt.%] [Xmole] .45 .07 .40 Cl- 53.8 0.475 .06 .35 .05 Na+ 30.0 0.408 .30 .25 .04 Mg+2 3.61 0.047 .20 .03 .15 NO3- <.01 <.001 .10 .02 FUNDING: NSF Grant No. CHE-0517972 NaCl .05 .01 *From CRC Handbook of Chemistry & Physics. Not all species are shown. Mg/Na 0 0 The NaCl & MgCl2 (Mg/Na) aerosol is chosen to simulate the composition of sea-salt (with respect to magnesium). 0 5 10 15 20 25 30 35 40 45 50 55 60 65 70 75 80 85 90 Relative Humidity Carrier Gas Stream