Download
1 / 12
150 likes | 514 Views
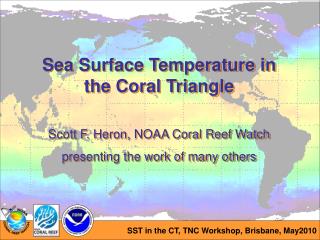
Sea surface temperature (SST) basics. NASA Ocean Biology Processing Group Goddard Space Flight Center, Greenbelt, Maryland, USA SeaDAS Training Material. MODIS sea surface temperature (SST). thermal band suite:. longwave SST (11-12 m), day and night

E N D
Sea surface temperature (SST) basics NASA Ocean Biology Processing Group Goddard Space Flight Center, Greenbelt, Maryland, USA SeaDAS Training Material SeaDAS Training ~ NASA Ocean Biology Processing Group
MODIS sea surface temperature (SST) thermal band suite: • longwave SST (11-12 m), day and night • shortwave SST (3.9 - 4.0 m), night only • SST quality level (0-4) • brightness temperatures (all thermal ) related ocean products: SeaDAS Training ~ NASA Ocean Biology Processing Group
MODIS data acquisition http://oceancolor.gsfc.nasa.gov/cgi/browse.pl SeaDAS Training ~ NASA Ocean Biology Processing Group
Level-2 SST processing (1) convert observed radiances to brightness temperatures (BTs) (2) apply empirical algorithm to relate brightness temperature in 2 wavelengths to SST sst = a0 + a1*BT1 + a2*(BT2-BT1) + a3*(1.0/-1.0) (3) assess quality (0=best, 4=not computed) * e.g., cloud or residual water vapor contamination * no specific “cloud mask” SeaDAS Training ~ NASA Ocean Biology Processing Group
Daytime SST products longwave SST shortwave SST cloud Sun glint SeaDAS Training ~ NASA Ocean Biology Processing Group
Nighttime SST products shortwave SST longwave SST Cloud cloud SeaDAS Training ~ NASA Ocean Biology Processing Group
SST quality levels shortwave SST shortwave SST QL QL=0 QL=1 QL=2 QL=3 QL=4 SeaDAS Training ~ NASA Ocean Biology Processing Group
SST quality tests SST quality tests SST quality levels SeaDAS Training ~ NASA Ocean Biology Processing Group
SST validation buoy measurements SeaDAS Training ~ NASA Ocean Biology Processing Group
References http://oceancolor.gsfc.nasa.gov/DOCS/modis_sst/ K.A. Kilpatrick et al., J. Geophys. Res. 106, 9179-9197 (2001) SeaDAS Training ~ NASA Ocean Biology Processing Group
Shortwave SST sst4 = a0 + a1*BT39 + a2*dBT + a3*(1.0/-1.0) where: BT39 = brightness temperature at 3.959 um, in deg-C BT40 = brightness temperature at 4.050 um, in deg-C = cosine of sensor zenith angle dBT = BT39 - BT40 a0, a1, a2, a3 - fit coefficients derived derived by regression of MODIS BTs with in situ buoys vary seasonally (probably due to residual water-vapor effects) determined by science team PI (Peter Minnett and Univ. Miami staff) SeaDAS Training ~ NASA Ocean Biology Processing Group
Longwave SST dBT <= 0.5 sst = a00 + a01*BT11 + a02*dBT*bsst + a03*dBT*(1.0/-1.0) dBT >= 0.9 sst = a10 + a11*BT11 + a12*dBT*bsst + a13*dBT*(1.0/-1.0) 0.5 < dBt < 0.9 sstlo = a00 + a01*BT11 + a02*dBT*bsst + a03*dBT*(1.0/-1.0) ssthi = a10 + a11*BT11 + a12*dBT*bsst + a13*dBT*(1.0/-1.0) sst = sstlo + (dBT-0.5)/(0.9-0.5)*(ssthi-sstlo) where: BT11 = brightness temperature at 11 um, in deg-C BT12 = brightness temperature at 12 um, in deg-C bsst = baseline SST, which is either sst4 (if valid) or sstref (from oisst) dBT = BT11 - BT12 = cosine of sensor zenith angle SeaDAS Training ~ NASA Ocean Biology Processing Group