Download
1 / 1
10 likes | 117 Views
Two-station Rayleigh and Love surface wave phase velocities between stations in Europe. EGU General Assembly 20 12. Ö. ÇAKIR, A. ERDURAN, E. KIRKAYA, Y.A. KUTLU, M. ERDURAN Nevsehir University, Department of Geophysics, 50300, Nevsehir, Turkey (ocakir@nevsehir.edu.tr). DATA AND METHOD

E N D
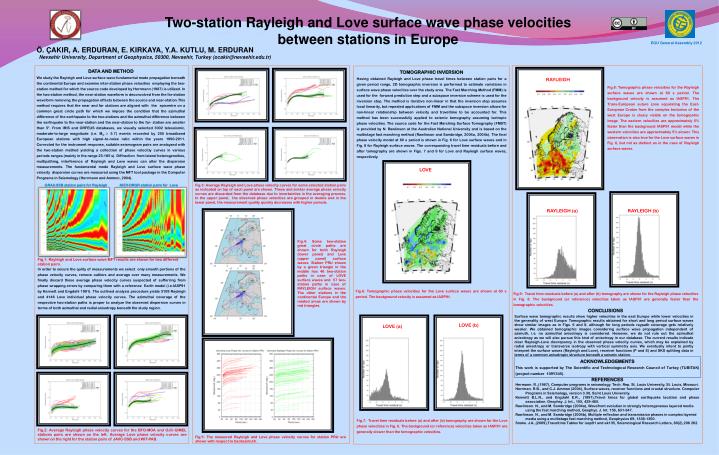
Two-station Rayleigh and Love surface wave phase velocities between stations in Europe EGU General Assembly 2012 Ö. ÇAKIR, A. ERDURAN, E. KIRKAYA, Y.A. KUTLU, M. ERDURAN Nevsehir University, Department of Geophysics, 50300, Nevsehir, Turkey (ocakir@nevsehir.edu.tr) DATA AND METHOD We study the Rayleigh and Love surface wave fundamental mode propagation beneath the continental Europe and examine inter-station phase velocities employing thetwo-station method for which the source code developed by Herrmann (1987) is utilized. In the two-station method, the near-station waveform is deconvolved from the far-station waveform removing the propagation effects between the source and near-station.This method requires that the near and far stations are aligned with the epicentre on a common great circle path for which we impose the condition that the azimuthal difference of the earthquake to the two-stations and the azimuthal difference between the earthquake to the near-station and the near-station to the far- station are smaller than 5°. From IRIS and ORFEUS databases, we visually selected 3002 teleseismic, moderate-to-large magnitude (i.e.Mw≥5.7) events recorded by 255 broadband European stations with high signal–to-noise ratio within the years 1990-2011.Corrected for the instrument response, suitable seismogram pairs are analayzed with the two-station method yielding a collection of phase velocitiy curves in various periods ranges (mainly in the range 25-185 s).Diffraction from lateral heterogeneities, multipathing, interference of Rayleigh and Love waves can alter the dispersion measurements. The fundamental mode Rayleigh and Love surfacewave phase velocity dispersion curves are measured using theMFT tool package in the Computer Programs in Seismology (Herrmann and Ammon, 2004). TOMOGRAPHIC INVERSION Having obtained Rayleigh and Love phase travel times betweenstation pairs for a given period range, 2D tomographicinversion is performed to estimate variations in surfacewave phase velocities over the study area.The Fast Marching Method (FMM) is used for the forward prediction step and a subspace inversion scheme is used for the inversion step. The method is iterative non-linear in that the inversion step assumes local linearity, but repeated applications of FMM and the subspace inversion allows for non-linear relationship between velocity and traveltime to be accounted for. This method hasbeen successfully applied to seismic tomography assuming isotropic phase velocities. The source code for the Fast Marching Surface Tomography(FMST) is provided by N. Rawlinson at the Australian National University and is based on the multistagefast marching method (Rawlinson and Sambridge,2004a, 2004b).The final phase velocity model at 60 s period is shown in Fig. 6 for Love surface waves and in Fig. 8 for Rayleigh surface waves. The corresponding travel time residuals before and after tomography are shown in Figs. 7 and 9 for Love and Rayleigh surface waves, respectively. RAYLEIGH Fig.8: Tomographic phase velocities for the Rayleigh surface waves are shown at 60 s period. The background velocity is assumed as IASP91. The Trans-European suture zone separating the East-European Craton from the complex tectonics of the west Europe is cleary visible on the tomogrpahic image. The eastern velocities are approximately 5% faster than the background IASP91 model while the western velocities are approximately 5% slower. This observation is also true for the Love surface waves in Fig. 6, but not as distinct as in the case of Rayleigh surface waves. LOVE GRA2-SSB station pairs for Rayleigh KIEV-DRGR station pairs for Love Fig.3: Average Rayleigh and Love phase velocity curves for some selected station pairs as indicated on top of each panel are shown. These and similar average phase velocity curves are discarded from the database due to incertainties in the averaging process. In the upper panel, the observed phase velocities are grouped in double and in the lower panel, the measurement quality quickly decreases with higher periods. RAYLEIGH (a) RAYLEIGH (b) Fig.4: Some two-station great circle paths are shown for both Rayleigh (lower panel) and Love (upper panel) surface waves. Station PRU shown by a green triangle in the middle has 46 two-station paths in case of LOVE surface waves and 57 two-station paths in case of RAYLEIGH surface waves. The other stations in the continental Europe and the related areas are shown by red triangles. Fig.1: Rayleigh and Love surface wave MFT results are shown for two different station pairs. In order to secure the qulity of measurements we select only smooth portions of the phase velocity curves, remove outliers and average over many measurements. We finally discard these average phase velocity curves suspected of sufferring from phase wrapping errors by comparing them with a reference Earth model (i.e.IASP91 by Kennett and Engdahl 1991). The outlined analysis procedure yields 5109 Rayleigh and 4146 Love individual phase velocity curves. The azimuthal coverage of the respective two-station paths is proper to analyze the observed dispersion curves in terms of both azimuthal and radial anisotropy beneath the study region. Fig.6: Tomographic phase velocities for the Love surface waves are shown at 60 s period. The background velocity is assumed as IASP91. Fig.9: Travel time residuals before (a) and after (b) tomography are shown for the Rayleigh phase velocities in Fig. 8. The background (or reference) velocities taken as IASP91 are generally faster than the tomographic velocities. CONCLUSIONS Surface wave tomographic results show higher velocities in the east Europe while lower velocities in the generality of west Europe. Tomographic results obtained for short and long period surface waves show similar images as in Figs. 6 and 8, although for long periods raypath coverage gets relatively weaker. We obtained tomographic images considering surface wave propagation independent of azimuth, i.e. no azimuthal anisotropy is considered. However, we do not rule out the azimuthal anisotropy as we will also pursue this kind of anisotropy in our database. The current results indicate clear Rayleigh-Love discrepancy in the observed phase velocity curves, which may be explained by radial anisotropy or transverse isotropy with vertical symmetry axis. We eventually intent to jointly interpret the surface waves (Rayleigh and Love), receiver functions (P and S) and SKS splitting data in terms of a common anisotropic structure beneath a seismic station. LOVE (b) LOVE (a) ACKNOWLEDGEMENTS This work is supported by The Scientific and Technological Research Council of Turkey (TUBITAK) (project number 109Y345). REFERENCES Hermann. R.,(1987), Computer programs in seismology. Tech. Rep. St. Louis University, St. Louis,Missouri. Herrman. R.B., and C.J. Ammon (2004), Surface waves, receiver functions and crustal structure. ComputerPrograms in Seismology, version 3.30, Saint Louis University. Kennett B.L.N., and Engdahl E.R., (1991),Travel times for global earthquake lacation and phase association, Geophsy. J. Int., 105, 429-465. Rawlinson. N., and M. Sambridge (2004a), Wavefront evolution in strongly heterogeneous layered media using the fast marching method, Geophys. J. Int. 156, 631-647. Rawlinson. N., and M. Sambridge (2004b), Multiple reflection and transmission phases in complex layered media using a multistage fast marching method, Geophysics 69, 1338-1350. Snoke. J.A.,(2009),Traveltime Tables for iasp91 and ak135, Seismological Research Letters, 80(2),206262. Fig.7: Travel time residuals before (a) and after (b) tomography are shown for the Love phase velocities in Fig. 6. The background (or reference) velocities taken as IASP91 are generally slower than the tomographic velocities. Fig.2: Average Rayleigh phase velocity curves for the BFO-MOA and OJC-GIMEL stations pairs are shown on the left. Average Love phase velocity curves are shown on the right for the station pairs of JAVC-SSB and WIT-PAB. Fig.5: The measured Rayleigh and Love phase velocity curves for station PRU are shown with respect to backazimuth.