Download
1 / 30
300 likes | 491 Views
RELAP5 Analysis of Two-Phase Decompression and Pressure Wave Propagation. Nathan N. Lafferty, Martin L. deBertodano, Victor H. Ransom Purdue University November 18, 2008. Demonstrate capability of RELAP5 to model single and two-phase wave propagation (fast transients)

E N D
RELAP5 Analysis of Two-Phase Decompression and Pressure Wave Propagation Nathan N. Lafferty, Martin L. deBertodano, Victor H. Ransom Purdue University November 18, 2008
Demonstrate capability of RELAP5 to model single and two-phase wave propagation (fast transients) • Use of fine temporal and spatial discretizations • Single-phase simulation benchmarked analytically • Two-phase simulation compared to experiment • Takeda and Toda experiment • RELAP5 uncertainties for fast transients • Steady-state interfacial area and heat transfer • Choked flow model at low pressure • Steady-state and fully developed flow interphase drag correlation • ……
Depressurization in Nuclear Systems Depressurization and propagation of rarefaction wave through piping to core Possible structural damage resulting in failure to maintain core geometry and cooling Provide conditions for structural damage modeling (not part of this research)
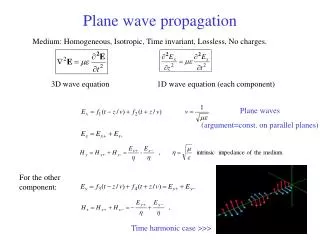
RELAP5 Two-Fluid Model • Conservation of mass • Momentum balance
Qualitative similarity • Shock wave remains steep • Rarefaction wave spreads as it propagates • Quantitative similarity • Pressure of Gas 2 • Analytic 1.402 MPa • RELAP5 1.406 MPa (0.29% error) • Shock wave velocity • Analytic 400.96 m/s • RELAP5 400.00 m/s (0.24% error) • Velocity of Gas 2 • Analytic 84.49 m/s • RELAP5 84.12 m/s (1.7% error)
RELAP5 Model of Takeda and Toda Experiment Water filled vertical pipe under temperature gradient 283.7K at base 437.9 K at top 5.35 cm inner diameter 3.2 m length 99 nodes, each 3.32 cm in length Saturation pressure at top is 6.96 bar Subcooled liquid initially pressurized to 8.55 bar at top Location of experiment pressure transducers (PT) PT 3 at 0.444 m from break PT 4 at 1.20 m from break PT 5 at 2.20 m from break 1.5 cm diameter junction for break orifice at top of pipe
RELAP5 Model of Takeda and Toda Experiment Abrupt area change model employed Ransom Trapp critical flow model used 0.55 ms break delay time to match delay seen in experiment Effect of wall heat transfer examined, but effects proved negligible Due to short duration of transient fluid temperature change is less than 1 K
Fluid discharge through break causes pressure to drop below saturation pressure until nucleation occurs • Nucleation of bubbles slows/stops pressure drop and causes flow to choke at reduced soundspeed • Liquid is now in a state of • Tension • Superheat • Vapor formation is thermally limited as spinodial limit is approached
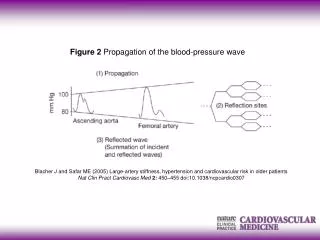
Wave Propagation and Reflection Initial pressure drop to nucleation pressure initiates propagation of a rarefaction wave Pressure of liquid decreased below saturation Initiates vaporization Waves reflected off solid boundaries in like sense with similar amplitude Waves reflected off constant pressure boundaries in opposite sense with similar amplitude
Spatial Convergence • 297 node model with nodal length of 1.077 m compared with 99 node model • Shown at PT 5 • 99 node model is spatially converged
Default Simulation PT 4 • Test for time step convergence (fast interphase processes) • Comparison with experimental data
Default Simulation 2D Contours Sound speed Pressure
Schematic of Pressure Drop and Rarefaction • Initial pressure undershoot and void formation • Sets pressure for rarefaction wave • Rarefaction wave reflects off pipe end and returns to top of pipe • More voiding and nonequilibrium effects occur
Reflection at Region of Sound Speed Change Sound speed changes at two-phase region (Davis, Princetion Univ Press, 2000) 1500 m/s for single-phase 50 m/s for two-phase Equation to calculate amplitudes AR - amplitude of reflected wave AI - amplitude of incident wave AT - amplitude of transmitted wave cT - transmitted fluid sound speed cI - incident fluid sound speed Wave will reflect in opposite sense with a magnitude similar to the incident wave
Default simulation • Rarefaction wave interacting with temperature gradient • Subsequent voiding occurs • Separate two-phase flow region appears • Wave becomes trapped • Two-phase region expands outward • Nonequilibrium effects
Interfacial Heat Transfer • Superheated liquid bubbly flow regime (at break) • Energy transfer from liquid to bubble interface • Interfacial area • concentration, , • important
Conclusions • RELAP5 proved capable of simulating fast transients with depressurizations and acoustic pressure wave propagation • RELAP5 simulation of air shock tube successfully validated with an analytic solution • RELAP5 simulation of two-phase decompression and wave propagation benchmarked with experimental data • Shortcomings in RELAP5 application identified • Interfacial area concentration • Choked flow model • After adjustments the simulation produced better results • Cause of dispersion and dissipation of wave identified as it being trapped inside a two-phase region
Justification for Bubble Diameter • Bubble growth controlled thermally for duration of the experiment • Bubble radius can be calculated using Plesset-Zwick theory with Rayleigh-Plesset equation • Bubble radius magnitude less than 2.3 mm bubble radius from RELAP5 • Justifies 0.1 multiplication factor for Laplace Length
Effect of Discharge Coefficient at PT 3 • Critical or Choked flow model is important in calculating initial pressure undershoot • The RELAP5 Default simulation overpredicts the pressure undershoot • Correlation by Alamgir and Lienhard used by RELAP5 for pressure undershoot • Valid for pressure drop rates between 0.004 and 1.803 Matm/s • Pressure drop rate calculated to be 0.002 Matm/s based on experimental data by Takeda and Toda • Subcooled discharge coefficient adjusted to correct for overprediction of pressure undershoot • Equivalent to reducing break area • Values less than 1.0 recommended for orifices • Could be remnants of Mylar paper obstructing break flow
Air Shock Tube • RELAP5 model of air shock tube • Validate use of RELAP5/MOD3.3 to predict single-phase wave propagation • Benefit of air shock tube is analytic solution exists • Gas 3 initialized at higher pressure than Gas 1 • Adiabatic and initially isothermal
Critical Flow Model • Comparison of • Ransom-Trapp • Henry-Fauske • Ransom-Trapp matches experimental results better and was used