Download

1 / 23
230 likes | 305 Views
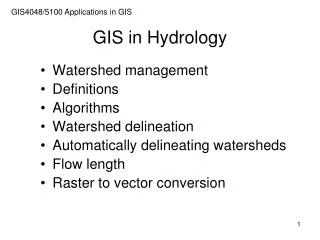
GIS in Hydrology Through a Broadcast Medium. Maureen McCann CE 394 Term Project November 30, 2010. Central Texas = Flash Flood Alley. Source: The Flood Safety Education Project. What’s the worst type of weather in Texas?. Turn Around, Don’t Drown!. Severe T’storm and Tornado WARNINGS

E N D
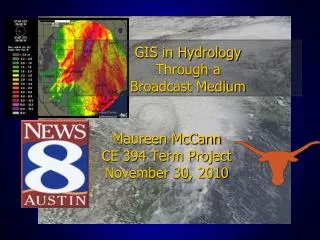
GIS in Hydrology Through a Broadcast Medium Maureen McCann CE 394 Term Project November 30, 2010
Central Texas = Flash Flood Alley Source: The Flood Safety Education Project
What’s the worst type of weather in Texas?
Severe T’storm and Tornado WARNINGS • Significant Flood Events • Maintain “first on, last off” coverage • Meteorologist(s) in the studio, reporters in the field • Social media interaction News 8 Austin Severe Weather Coverage
What do we use now? • National Weather Service, NOAA Branches • LCRA • CoCoRAHs • News 8 Weather Watchers • WSI Suite
What would be useful? • Accessing GIS data in TV graphics to enhance coverage and provide viewers with pertinent information GIS
WISH LIST • Collaborated with Dr. Maidment, Chief Meteorologist, ESRI professionals, held workshops… • How could we combine…
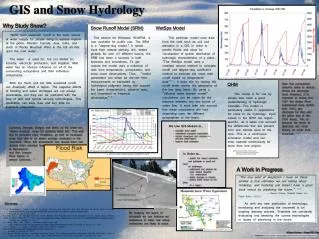
NEXRAD/Precip data • Time-based estimates • Manually corrected rainfall estimates Source: CRWR Group Maps, ArcGIS.com
NEXRAD data sites Source: NWIS precip map, Scoffield
Ground Observations • Surface data • ASOS/AWOS sites • CoCoRAHs • Mesonet data (LCRA, Brazos River, Guadalupe River, Brushy Creek, etc) Source: West Texas Mesonet Source: Upper Brushy Creek WCID
Flood Info • Stream gauges: LCRA, USGS, other water authorities • Inundation levels • Hypothetical flood scenarios • Flood history/ comparable events Source: CRWR Group Maps, ArcGIS.com
Low Water Crossings • Usually prone sites • Alternative routes • Road closures • TXDot data Source: Hays County Online
Emergency Response • Live data from emergency response showing where rescues are occurring (from real-time fire call data?) • Available shelters?
Social Media • Twitter/Facebook • #hashtags relevant to the weather event (#TXwx, #weather, #Hermine etc) • tweets by geographical proximity • Photos/live web cams where available, geotagged • News 8 Weather stations
Next Steps • Combine all of these ideas into a usable interface – toggle between data sources • Written in one language… WaterML? • Merge GIS to TV Weather Vendor graphics (WSI, Weather Central, AccuWeather etc) • Use on air!
http://news8austin.com/weather For More Information
Thank you! Maureen McCann AMS Certified Broadcast Meteorologist mmccann@news8austin.com @maureenmccann8