Download
1 / 52
520 likes | 643 Views
Economics 160. Lecture 7 Professor Votey Crime Control: Equity vs. Efficiency. Votey, Lecture 4, Notes , p. 57. Crime Control: Equity vs. Efficiency. The Economic Paradigm Recall the 3 steps A laudable goal: economic efficiency

E N D
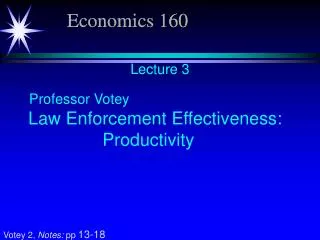
Economics 160 Lecture 7 Professor Votey Crime Control: Equity vs. Efficiency Votey, Lecture 4, Notes, p. 57
Crime Control: Equity vs. Efficiency • The Economic Paradigm • Recall the 3 steps • A laudable goal:economic efficiency • We have no guidance to so conceptually perfect a distribution of efficiency’s product • The Search for Equity • Here, the Economc Paradigm has nothing to say • Lester Thurow, “Equity vs. Efficiency in Law Enforcement:” • Equity in law enforcement: making some people better off -by making us collectively worse off? • Disparate Crime Levels • North Dakota vs. California • Santa Barbara County vs. Isla Vista
Achieving Equity • If Efficiencyis easy, why is equity hard? • Efficiency:The competitive market system • Equity:the people vs. Whom? • The American Revolution
Why did we go to war with England? • “Taxation without representation” • Unfair regulation of our trade • No say in the enactment of laws governing the colonies No Magna Carta Libertatum ("Great Charter of Freedoms")for us
Achieving Equity • The Constitution • Our representatives spell out how we shall be governed • Our rights and responsibilities are set down • Equity is served
Achieving Equity • Preamble to the Constitution • the Union was formed: • “to . . . establish justice, insure domestic tranquility, . . • ., . . .promote the general welfare.” …. • But
Achieving Equity • Article IV, Section 4. • There is no explicit mention of Congressional power to deal with domestic crime. The article states: • states can get help in cases of “domestic violence . . . on application of the Legislature, or the Executive (when the Legislature cannot be convened)”.
Achieving Equity • Amendment X. • Control of crime is left to the states • “STATES RIGHTSPowers not delegated to the United States by the Constitution nor prohibited by it to the States, are reserved to the States respectively, or to the people.” • Note that criminal cases in court are described as “The People versus . . .”
Achieving Equity • Article VI, Section 2. • “The citizens of each State shall be entitled to all of the Privileges and Immunities of the Citizens in the several States.”
Achieving Equity • The Declaration of Independence • asserts:“all men are created equal, that they are endowed by their Creator with certain, inalienable rights, that among these are Life, Liberty, and the pursuit of Happiness.”
Achieving Equity • PoliticiansMUSTbelieve in Equity • Maybe we should just say Should believe in equity
Achieving Equity What is the evidence? • IfEfficiencyis easy, why is equity hard? • Efficiency:The competitive market system • Equity:the people vs. Whom? • PoliticiansMUSTbelieve in Equity • Crime Victimization:
Achieving Equity • If Efficiency is easy, why is equity hard ?Efficiency: The competitive market system Equity: the people vs. Whom? Politicians MUST believe in Equity • Crime Victimization:Equity?
Achieving Equity • Crime Victimization:Equity? • Youths • the most likely victims of crime • Violence peak: Victim age approx. 20 • Theft peak: Victim age approx. 22
Achieving Equity • Crime Victimization:Equity? • Males • More likely victims of theft • Much more likely victims of violence
Achieving Equity • Crime Victimization:Equity? • Blacks • most likely victims of violence • approx. equal to whites as victims of theft
Achieving Equity • Crime Victimization:Equity? • the Poor • more likely victims of violence • for incomes <$3,000, >25,000, equally high for theft • Report to the Nation, data from 1980
Back to Economic Theory (Notes, p. 58) 4 Concepts 1. The Expenditure Function (for Law Enforcement) $wL w = Wage for Police i.e., Resource Cost L = Resource quantity E B wL1 Note that: tan a=AB=wL1=w 0A L1 a A wL is the Expenditure Level, so any point on line 0E represents the expenditure level for the corresponding level of L 0 L1 L Resources
4 Concepts (-cont.) 2. Isovalue Line $wL This is the Budget Constraint of a Higher Income Community wL1 * $M1 $M Other Goods and Services *450 if scale same on both axes
4 Concepts (-cont.) 3. Community Preferences (Indifference Curves) Curves tend to imply that as incomes rise, the community would pay more to eliminate a given amount of crime U3 U2 $M U1 Other Goods and Services U3 > U2 > U1 DOF 0 OF1 OF Public Safety (GOOD) Offenses (a BAD)
4 Concepts (-cont.) 4. Crime Control Technology OF If Crime is Controllable OF1 OF2 0 L1 L2 L Resources
4 Concepts (-cont.) 4. Crime Control Technology OF If Crime is not Controllable the curve would look like this 0 L Resources
I. II. $M 2. Budget Constraint 3.Preferences Crime-Consumption Possibility Frontier MR N OF 0 OFR wLR $wL LR OFR is the Cost Minimizing level of Offenses with $wLR expenditures for Crime Control 1.Expenditure Function 4.Crime Control Technology L III. IV.
I. II. $M 2. Budget Constraint 3.Preferences Suppose there is also a Poor Community, with income YPYP YR Crime-Consumption Possibility Frontier YP N OF YR YP 0 OFR $wL Questions? 1.Expenditure Function 4.Crime Control Technology L III. IV.
I. II. $M 2. Budget Constraint 3.Preferences Suppose there is also a Poor Community, with income YPYP YR Crime-Consumption Possibility Frontier YP N OF YR YP 0 OFR $wL 1.Expenditure Function 4.Crime Control Technology L III. IV.
I. II. $M 2. Budget Constraint 3.Preferences Suppose there is also a Poor Community, with income YPYP YR Crime-Consumption Possibility Frontier YP N OF YR YP 0 OFR $wL 1.Expenditure Function 4.Crime Control Technology L III. IV.
I. II. $M 2. Budget Constraint 3.Preferences Suppose there is also a Poor Community, with income YPYP YR Crime-Consumption Possibility Frontier YP N S OF YR YP 0 OFR OFP $wL 1.Expenditure Function 4.Crime Control Technology L III. IV.
I. II. $M 2. Budget Constraint 3.Preferences YR Crime-Consumption Possibility Frontier YP N S OF YR YP 0 OFR OFP $wL Note that the Poor community has a higher level of crime, OFP > OFR (See Notes, Fig. 4.6) 1.Expenditure Function 4.Crime Control Technology L III. IV.
I. II. $M 2. Budget Constraint 3.Preferences YR Crime-Consumption Possibility Frontier YP N S OF YR YP 0 OFR OFP $wL Note that the Poor community has a higher level of crime, OFP > OFR 1.Expenditure Function 4.Crime Control Technology L III. IV.
I. II. $M 2. Budget Constraint 3.Preferences YR Crime-Consumption Possibility Frontier YP N S OF YR YP 0 OFR OFP $wL Note that the Poor community has a higher level of crime, OFP > OFR Yet the Poor community is spending a greater share of its lower income on Crime Control (See Notes, Fig. 4.7) 1.Expenditure Function 4.Crime Control Technology L III. IV.
I. II. $M 2. Budget Constraint 3.Preferences The implications of this can be seen by closer examination of the result in Quadrant IV. YR Crime-Consumption Possibility Frontier YP N S OF YR YP 0 OFR OFP $wL P R 1.Expenditure Function 4.Crime Control Technology L III. IV.
I. II. $M 2. Budget Constraint 3.Preferences The implications of this can be seen by closer examination of the result in Quadrant IV. YR Crime-Consumption Possibility Frontier YP N S OF YR YP 0 OFR OFP $wL P R 1.Expenditure Function 4.Crime Control Technology L III. IV.
I. II. $M 2. Budget Constraint 3.Preferences YR Crime-Consumption Possibility Frontier YP N S OF YR YP 0 OFR OFP $wL P R Points P and R are the cost minimizing points for the Poor and Rich communities 1.Expenditure Function 4.Crime Control Technology L III. IV.
I. II. $M 2. Budget Constraint 3.Preferences YR Crime-Consumption Possibility Frontier YP N S OF p YR YP 0 OFR OFP $wL P R The Orange (pp) line reflects the imputed relative price of resources to offenses for the Poor community. (see Notes, Fig.4.9) p 1.Expenditure Function 4.Crime Control Technology L III. IV.
I. II. $M 2. Budget Constraint 3.Preferences YR Crime-Consumption Possibility Frontier YP N S OF r YR YP 0 OFR OFPr P $wL P R P The Red (rr) line reflects the imputed relative price of resources to offenses for the Rich community. r 1.Expenditure Function 4.Crime Control Technology L III. IV.
The Implicit Value the Community Places on Public Safety or Losses to Crime Economic Theory: 2 Goods Slope of AB = tan a=0A 0B =quantity of Y quantity of X = pX / pY or = price of X in terms of Y Y (Oranges) A Y1 Line AB can be thought of as the budget constraint which can also be written as Income = pX.X1 + pY.Y1 a 0 B X (Apples) X1 Understanding this allows us to impute the price the community places on Crime
It helps to rotate the figure (Notes, Fig. 4.6) in Quadrant IV. 900 to the left OF Line pp represents the Social Cost of Crime for the Poor community. How ? p r P R Crime Control Technology r p 0 L At the upper left end we have all offenses, no control costs. At the lower right end, we have all resource costs, no crime. At P, we have the attainable mix chosen by society. The line pp is an isovalue line like the budget constraint, and in this case is the lowest attainable cost of crime for the Poor community.
Consider what Minimum Social Cost of Crime means: The Objective has been written: Min. SC = VC + CC (victim costs plus control costs) This is the same as Min. SC = r . OF + w . L where r is the loss rate or damages to the victim, per offense (OF), and w is the resource price or wage per resource unit (L). Just as with the Budget Constraint Income = pX. X + pY. Y and as in the theoretical illustration
The Implicit Value the Community Places on Public Safety or Losses to Crime Economic Theory: 2 Goods • Slope of AB = tan a=0A • 0B • =quantity of Y • quantity of X • = price of X in terms of Y Y (Oranges) A Y1 a B 0 X (Apples) X1
Consider what Minimum Social Cost of Crime means: (-cont.) • Slope of AB = tan a=0A 0B =quantity of Y quantity of X = pX / pY or = price of X in terms of Y, similarly Slope of pp=quantity of offenses= pL / pOF = w quantity of resoursesr Finally, since, in absolute value, the slope of pp is greater than the slope of rr (look again at the figure from Quadrant IV.)
The figure from Quadrant IV. rotated 900 to the left OF p r P R Crime Control Technology r p L
Consider what Minimum Social Cost of Crime means: (-cont.) • Slope of AB = tan a=0A 0B =quantity of Y quantity of X = pX / pY or = price of X in terms of Y, similarly Slope of pp =quantity of offenses= pL / pOF =w quantity of resourses r Finally, since, in absolute value, the slope of pp is greater than the slope of rr ,this implies that (w / r) for the Poor community > (w / r) for the Rich community
Consider what Minimum Social Cost of Crime means: (-cont.) • Slope of AB = tan a=0A 0B =quantity of Y quantity of X = pX / pY or = price of X in terms of Y, similarly Slope of pp =quantity of offenses= pL / pOF = w quantity of resourses r Finally, since, in absolute value, the slope of pp is greater than tha slope of rr (look again at the figure from Quadrant IV.), this implies that (w / r)for the Poor community > (w / r) for the Rich community Which, in turn, means that the loss rate (r) for the Poor community is smaller than that for the Rich community.
The logic and the irony: Efficiency does not lead to Equity It should not be surprising that damages per offense are lower in poor communities than in rich ones. Nor should it be surprising that rich communities are more willing to pay for defense against crime. The irony is that, in the face of this,poor communitieswill have a tendency to spend a greater proportion of income on crime controland yet suffer from higher crime rates.
The logic and the irony: Efficiency does not lead to Equity It should not be surprising that damages per offense are lower in poor communities than in rich ones. Nor should it be surprising that rich communities are more willing to pay for defense against crime. The irony is that, in the face of this, poor communities will have a tendency to spend a greater proportion of income on crime control and yet suffer from higher crime rates. The theoretical model is supported by empirical evidence. See references to real world data in this regard in Phillips & Votey, Ch. 5
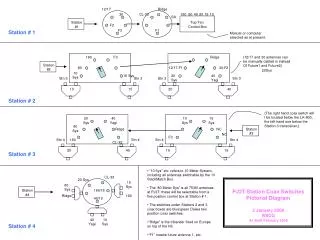
The Bad News may not be over So far we have assumed that communities have identical preferences and identical crime control technologies. Suppose, however, thatthe poor community is lacking in economic opportunitiesfor youth and women, relative to the rich community. How would this affect the outcome? Consider the Crime Control Technology
Consider the Crime Control Technology Recall: OF = g( CR, SV,SE, MC) CR = f( OF, L ) OF OFP CCTP|SE2 OFR CCTR|SE1 L1 L Resources
I. II. $M 2. Budget Constraint 3.Preferences YR Crime-Consumption Possibility Frontier YP N S OF YR YP 0 OFR OFP $wL A still higher Offense Rate And an Even greater proportion of income spent for crime control 1.Expenditure Function 4.Crime Control Technology L III. IV.
Questions ? Conclusions? • What does it take to achieve equity? • A tax on rich communities • How might we characterize the impact of crime on the poor communities of our analysis? • Asa disproportionate tax on the poor • How do we reconcile this with Adam Smith’s conclusions re “the invisible hand”?
Non-Market Decisionmaking • Is achieved in a democratic society thru the political process • Adam Smith recognized that the market did not solve all problems • A competitivemarket leads toEfficiency • A concerned citizenryachievesEquity(thru political processes) Most political debates deal with equity issues