Download
1 / 60
600 likes | 645 Views
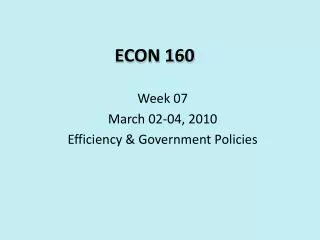
Economics 160. Lecture 7 Professor Votey Crime Control: Equity vs. Efficiency. Votey, Lecture 4, Notes , p. 51. Today’s Topic. Crime Control: Equity vs. Efficiency. Notes, p.51.

E N D
Economics 160 Lecture 7 Professor Votey Crime Control: Equity vs. Efficiency Votey, Lecture 4, Notes, p. 51
Today’s Topic Crime Control: Equity vs. Efficiency Notes, p.51
Efficiency has always been considered an easy objective – because it resulted almost automatically with competitive markets
Crime Control: Equity vs. Efficiency • The Economic Paradigm • Recall the 3 steps • In a market economy, we expect competitive markets to lead us to efficiency • In fact, For Economic Efficiency the process is virtually automatic in an efficient market system. • But in a non-market decision process, it is the Economic Paradigm that gets us there • A laudable goal:Economic Efficiency – the power behind our Cold War success. • But Equity is about Fairness-in an economic sense that is reflected in the Distribution of Income • We have NO theoretical guidance to a distributionof income so conceptually perfect as Pareto Optimality, and Efficient Markets won’t get us there.
Recall: When there were objections to the form of Bush’s tax cut legislation – • George Bush accused opponents of class warfare. • It was a clever strategy - the equivalent of trying to seize the high ground in a battle. • If anyone were to be accused of class warfare, it should have been George Bush. • In fact, the Bush policies affected the income distribution adversely in two ways: • A recent study shows that the states that voted for Bush and his policies uniformly received a significantly greater share of federal subsidies and other support than those that didn’t. • And the upper 5-10% of the income distribution received substantially larger shares of the benefits than lower income classes.
The distribution of income is always a sensitive topic. • Now, conservatives are trying to maintain the Bush position by claiming that, in the current recession, it is the upper income brackets that invest their money to create jobs. • But, in a recent online debate, it was pointed out that it wasn’t theextremeupper end of the distribution who would invest in job creating activities. • Those people are conservative investors who invest to protect their positions, • Rather, it is the uppermiddle classinvestors trying to reach that upper bracket who will invest to create new jobs.
Crime Control: Equity vs. Efficiency • The Search for Equity • Lester Thurow’s discussion of the problem, “Equity vs. Efficiency in Law Enforcement” makes an entirely different point. • His quote: • Equity in law enforcement will make some people better off -by making us collectively worse off? • Disparate Crime Levels • North Dakota vs. California • The rest of Santa Barbara County vs. Isla Vista
If Efficiencyis easy, why is equity hard? • Efficiency:The competitive market system • Even here it has been a while since we have had a truly competitive market for much of what we consume. • How many times have we seen a firm, fighting against competition seeking a merger to gain market power? • So the fact is – efficiency recently hasn’t been easy because the curbs we had on monopoly have been little used of late. • Once more, the consumer loses out, particularly at the lower end of the income distribution. • Producers don’t really want competitive markets. They want markets they can dominate.
Equity: Is about What is Fair? • Our country has a long history in the search for equity -from the sit down strikes in the auto industry in the 30’s and the strikes of the coal miners in the 40’s to the reaction to the corruption of labor leaders with the Teamsters. • The American Revolution
Achieving Equity • Now we have people being hurt by the economy again and equity has a renewed focus. The working middle class has been ignored. • We are back to asking ourselves: How do we deal with equity issues? • It was mostly what we talked about leading to the past national election. • The American pursuit of equity starts with The American Revolution
Why did we go to war with England? • “Taxation without representation” • Unfair regulation of our trade • No say in the enactment of laws governing the colonies. No Magna Carta Libertatum ("Great Charter of Freedoms")for us • It was a desire for freedom – but underlying that was a search for equity • How does all of this relate to crime and justice?
Achieving Equity • The Constitution • Our representatives spelled out how we shall be governed • Our rights and responsibilities are set down • Equity is served
Achieving Equity • Preamble to the Constitution • the Union was formed: • “to . . . establish justice, insure domestic tranquility. • ., . . .promote the general welfare.” • But
Achieving Equity • Article IV, Section 4. • There is no explicit mention of Congressional power to deal with domestic crime. The article states: • states can get help in cases of “domestic violence . . . on application of the Legislature, or the Executive (when the Legislature cannot be convened)”.
Achieving Equity • Amendment X. • Control of crime is left to the states: • “STATES RIGHTSPowers not delegated to the United States by the Constitution nor prohibited by it to the States, are reserved to the States respectively, or to the people.” • Note that criminal cases in court are described as “The People versus . . .”
Achieving Equity • Article VI, Section 2. • “The citizens of each State shall be entitled to all of the Privileges and Immunities of the Citizens in the several States.”
Achieving Equity • The Declaration of Independence • asserts:“all men are created equal, that they are endowed by their Creator with certain, inalienable rights, that among these are Life, Liberty, and the pursuit of Happiness.”
Achieving Equity • PoliticiansMUSTbelieve in Equity • Maybe we should just say Should believe in equity
Achieving Equity What is the evidence? • Compared toEfficiency,equity is hard • When dealing with crime, Equity is • the people vs. Whom? • but it can be other effects as well • PoliticiansMUSTbelieve in Equity? • Crime Victimization: Is it equitable?
Achieving Equity • Crime Victimization:Equity? • Youths • the most likely victims of crime • Violence peak: Victim age approx. 19 • Theft peak: Victim age approx. 20
Achieving Equity • Crime Victimization:Equity? • Males • More likely victims of theft • Much more likely victims of violence
Achieving Equity • Crime Victimization:Equity? • Blacks and hispanics • most likely victims of violence • approx. equal to whites as victims of theft
Achieving Equity • Crime Victimization:Equity? • the Poor • more likely victims of violence • for incomes Less than $30,000, equally high for theft • Report to the Nation, data from 1985
Back to Economic Theory (Notes, p. 52) 4 Concepts 1. The Expenditure Function (for Law Enforcement) $wL w = Wage for Police i.e., Resource Cost L = Resource quantity E B wL1 Note that: tan a=AB=wL1=w 0A L1 a A wL is the Expenditure Level, so any point on line 0E represents the expenditure level for the corresponding level of L 0 L1 L Resources Notes, p.53
4 Concepts (-cont.) 2. Isovalue Line $wL This is the Budget Constraint of a Higher Income Community wL1 * $M1 $M Other Goods and Services *450 if scale same on both axes Notes, p.53
4 Concepts (-cont.) 3. Community Preferences (Indifference Curves) Curves imply that as incomes rise, the community would pay more to eliminate a given amount of crime U3 U2 $M U1 Other Goods and Services U3 > U2 > U1 DOF 0 OF1 OF Public Safety (GOOD) Offenses (a BAD) Notes, p.52
4 Concepts (-cont.) 4. Crime Control Technology OF If Crime is Controllable OF1 OF2 0 L1 L2 L Resources Notes, p.52
4 Concepts (-cont.) 4. Crime Control Technology OF If Crime is not Controllable the curve would look like this 0 L Resources Notes, p.52
I. II. 2. Budget Constraint 3.Preferences $M MR N Crime-Consumption Possibility Frontier OF 0 OFR wLR $wL LR OFR is the Cost Minimizing level of Offenses with $wLR expenditures for Crime Control L 1.Expenditure Function 4.Crime Control Technology III. Notes, p.53 IV.
I. II. $M 2. Budget Constraint 3.Preferences Suppose there is also a Poor Community, with income YPYP YR Crime-Consumption Possibility Frontier YP N OF YR YP 0 OFR $wL Questions? 1.Expenditure Function 4.Crime Control Technology L III. Notes, p.54 IV.
I. II. $M 2. Budget Constraint3.Preferences Suppose there is also a Poor Community, with income YPYP YR Crime-Consumption Possibility Frontier YP N OF YR YP 0 OFR $wL 1.Expenditure Function4.Crime Control Technology L III. Notes, p.54 IV.
I. II. $M 2. Budget Constraint 3.Preferences Suppose there is also a Poor Community, with income YPYP YR Crime-Consumption Possibility Frontier YP N OF YR YP 0 OFR $wL 1.Expenditure Function 4.Crime Control Technology L III. Notes, p.54 IV.
I. II. $M 2. Budget Constraint3.Preferences Suppose there is also a Poor Community, with income YPYP YR Crime-Consumption Possibility Frontier YP N S OF YR YP 0 OFR OFP $wL 1.Expenditure Function 4.Crime Control Technology L III. Notes, p.54 IV.
I. II. $M 2. Budget Constraint 3.Preferences YR Crime-Consumption Possibility Frontier YP N S OF YR YP 0 OFR OFP $wL Note that the Poor community has a higher level of crime, OFP > OFR (See Notes, Fig. 4.6) 1.Expenditure Function 4.Crime Control Technology L III. Notes, p.45 IV.
I. II. $M 2. Budget Constraint 3.Preferences YR Crime-Consumption Possibility Frontier YP N S OF YR YP 0 OFR OFP $wL Note that the Poor community has a higher level of crime, OFP > OFR 1.Expenditure Function 4.Crime Control Technology L III. Notes, p.54 IV.
I. II. $M 2. Budget Constraint 3.Preferences YR Crime-Consumption Possibility Frontier YP N S OF YR YP 0 OFR OFP $wL Note that the Poor community has a higher level of crime, OFP > OFR Yet the Poor community is spending a greater share of its lower income on Crime Control (See Notes, Fig. 4.7) 1.Expenditure Function 4.Crime Control Technology L III. Notes, p.54 IV.
I. II. $M 2. Budget Constraint 3.Preferences The implications of this can be seen by closer examination of the result in Quadrant IV. YR Crime-Consumption Possibility Frontier YP N S OF YR YP 0 OFR OFP $wL P R 1.Expenditure Function 4.Crime Control Technology L III. Notes, p.54IV.
I. II. $M 2. Budget Constraint 3.Preferences The implications of this can be seen by closer examination of the result in Quadrant IV. YR Crime-Consumption Possibility Frontier YP N S OF YR YP 0 OFR OFP $wL P R 1.Expenditure Function 4.Crime Control Technology L III. Notes, p.54 IV.
I. II. $M 2. Budget Constraint 3.Preferences YR Crime-Consumption Possibility Frontier YP N S OF YR YP 0 OFR OFP $wL P R Points P and R are the cost minimizing points for the Poor and Rich communities 1.Expenditure Function 4.Crime Control Technology L III. Notes, p.54 IV.
II. I. $M 2. Budget Constraint 3.Preferences YR Crime-Consumption Possibility Frontier YP N S OF p YR YP 0 OFR OFP $wL P R The Orange (pp) line reflects the imputed relative price of resources to offenses for the Poor community. (see Notes, Fig.4.9) p 1.Expenditure Function 4.Crime Control Technology II. L Notes, p.54 IV
I. II. $M 2. Budget Constraint 3.Preferences YR Crime-Consumption Possibility Frontier YP N S OF r YR YP 0 OFR OFPr P $wL P R P The Red (rr) line reflects the imputed relative price of resources to offenses for the Rich community. r 1.Expenditure Function 4.Crime Control Technology L III. IV. Notes, p.54
The Implicit Value the Community Places on Public Safety or Losses to Crime Economic Theory: 2 Goods Slope of AB = tan a=0A 0B =quantity of Y quantity of X = pX / pY or = price of X in terms of Y Y (Oranges) A Y1 Line AB can be thought of as the budget constraint which can also be written as Income = pX.X1 + pY.Y1 a 0 B X (Apples) X1 Understanding this allows us to impute the price the community places on Crime
It helps to rotate the figure (Notes, Fig. 4.6) in Quadrant IV. 900 to the left OF Line pp represents the Social Cost of Crime for the Poor community. How ? p r P R Crime Control Technology r p 0 L At the upper left end we have all offenses, no control costs. At the lower right end, we have all resource costs, no crime. At P, we have the attainable mix chosen by society. The line pp is an isovalue line like the budget constraint, and in this case is the lowest attainable cost of crime for the Poor community.
Consider what Minimum Social Cost of Crime means: The Objective has been written: Min. SC = VC + CC (victim costs plus control costs) This is the same as Min. SC = r . OF + w . L where r is the loss rate or damages to the victim, per offense (OF), and w is the resource price or wage per resource unit (L). Just as with the Budget Constraint Income = pX. X + pY. Y and as in the theoretical illustration
The Implicit Value the Community Places on Public Safety or Losses to Crime Economic Theory: 2 Goods • Slope of AB = tan a=0A • 0B • =quantity of Y • quantity of X • = price of X in terms of Y Y (Oranges) A Y1 a B 0 X (Apples) X1
Consider what Minimum Social Cost of Crime means: (-cont.) • Slope of AB = tan a=0A 0B =quantity of Y quantity of X = pX / pY or = price of X in terms of Y, similarly Slope of pp=quantity of offenses= pL / pOF = w quantity of resourcesr Finally, since, in absolute value, the slope of pp is greater than the slope of rr (look again at the figure from Quadrant IV.)
The figure from Quadrant IV. rotated 900 to the left OF p r P R Crime Control Technology r p L
Consider what Minimum Social Cost of Crime means: (-cont.) • Slope of AB = tan a=0A 0B =quantity of Y quantity of X = pX / pY or = price of X in terms of Y, similarly Slope of pp =quantity of offenses= pL / pOF =w quantity of resources r Finally, since, in absolute value, the slope of pp is greater than the slope of rr ,this implies that (w / r) for the Poor community > (w / r) for the Rich community
Consider what Minimum Social Cost of Crime means: (-cont.) • Slope of AB = tan a=0A 0B =quantity of Y quantity of X = pX / pY or = price of X in terms of Y, similarly Slope of pp =quantity of offenses= pL / pOF = w quantity of resources r Finally, since, in absolute value, the slope of pp is greater than tha slope of rr (look again at the figure from Quadrant IV.), this implies that (w / r)for the Poor community > (w / r) for the Rich community Which, in turn, means that the loss rate (r) for the Poor community is smaller than that for the Rich community.
The logic and the irony: Efficiency does not lead to Equity It should not be surprising that damages per offense are lower in poor communities than in rich ones. Nor should it be surprising that rich communities are more willing to pay for defense against crime. The irony is that, in the face of this,poor communitieswill have a tendency to spend a greater proportion of income on crime controlandyet sufferfrom higher crime rates.