Download
1 / 23
230 likes | 292 Views
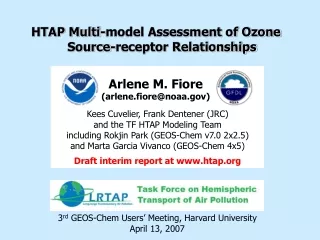
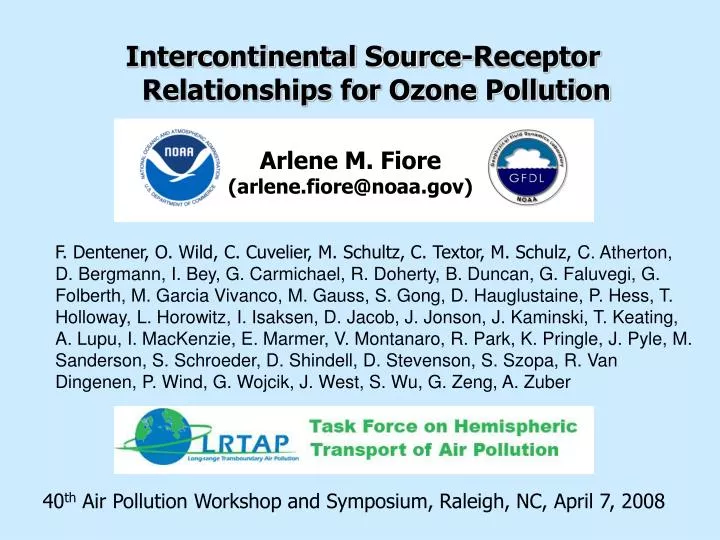
Intercontinental Source-Receptor Relationships for Ozone Pollution. Arlene M. Fiore (arlene.fiore@noaa.gov).

E N D
Intercontinental Source-Receptor Relationships for Ozone Pollution Arlene M. Fiore (arlene.fiore@noaa.gov) F. Dentener, O. Wild, C. Cuvelier, M. Schultz, C. Textor, M. Schulz, C. Atherton, D. Bergmann, I. Bey, G. Carmichael, R. Doherty, B. Duncan, G. Faluvegi, G. Folberth, M. Garcia Vivanco, M. Gauss, S. Gong, D. Hauglustaine, P. Hess, T. Holloway, L. Horowitz, I. Isaksen, D. Jacob, J. Jonson, J. Kaminski, T. Keating, A. Lupu, I. MacKenzie, E. Marmer, V. Montanaro, R. Park, K. Pringle, J. Pyle, M. Sanderson, S. Schroeder, D. Shindell, D. Stevenson, S. Szopa, R. Van Dingenen, P. Wind, G. Wojcik, J. West, S. Wu, G. Zeng, A. Zuber 40th Air Pollution Workshop and Symposium, Raleigh, NC, April 7, 2008
Evidence of intercontinental transport at northern midlatitudes: 2001 Asian dust event Clear Day April 16, 2001 Dust leaving the Asian coast in April 2001 Image c/o NASA SeaWiFS Project and ORBIMAGE Reduced Visibility from Transpacific Transport of Asian Dust Glen Canyon, Arizona
How do we estimate source-receptor (S-R) relationships that describe hemispheric transport of air pollution? 3D Model Structure Models with anthropogenic emissions reduced in source regions? Measurements at remote sites? (Monitoring site at Yosemite NP) Difficult to directly measure a region’s contribution to pollution over a receptor region, particularly for ozone [e.g.Goldstein et al., 2004]
longer O3 season Regional control efforts (even under optimistic scenarios)may be offset by increases in hemispheric ozone pollution By 2030 under the Current LEgislation (CLE) scenario, “the benefit of European emission control measures is… significantly counterbalanced by increasing global O3 levels…” [Szopa et al., GRL, 2006] U.S. grid-square days with 1-5p.m. O3 > 70 ppb 1995 Base case 2030 A1 GEOS-Chem Model (4°x5°) [Fiore et al., GRL, 2002] U.S. air quality degrades despite domestic emissions controls (A1 2030) International approach to ozone abatement?
Convention on Long-Range Transboundary Air Pollution (CLRTAP) 51 parties in Europe, North America, and Central Asia Co-chairs: Terry Keating (U.S. EPA) and André Zuber (EC) TF HTAP Mission: Develop a fuller understanding of hemispheric transport of air pollution to inform future negotiations under CLRTAP
EU NA EA SA Multi-model assessment involving >25 modeling groups OBJECTIVES: Quantify S-R relationships for HTAP regions and assess uncertainties in these estimates HTAP S-R Regions • Focus species: • Ozone and precursors • Aerosols and precursors • Mercury • Persistent Organic Pollutants • Idealized Tracers • Oxidized Nitrogen PRODUCTS: 2007 Interim Reportto inform the review of the 1999 CLRTAP Gothenburg Protocol to abate acidification, eutrophication, and tropospheric ozone (www.htap.org). 2009 Assessment Reportto inform the CLRTAP on hemispheric air pollution and S-R relationships.
Wide range in literature estimates of mean surface O3 S-R relationships at northern mid-latitudes Receptor = North America Receptor = Asia Receptor = Europe • Assessment hindered by different: • methods • regional definitions • reported metrics • years (meteorology) • Adopt a multi-model approach • Consistency across models • Examine all seasons Estimates are from studies cited in TF HTAP [2007] Ch5, plus new work [Holloway et al., 2008; Duncan et al., 2008; Lin et al., 2008] A.M. Fiore
EMEP CASTNet EANET Model Setup for TF HTAP Ozone S-R Study BASE SIMULATION horizontal resolution of 4°x5° or finer 2001 meteorology each group’s best estimate for emissions in 2001 methane set to a uniform value of 1760 ppb SENSITIVITY SIMULATIONS (17 total) with sustained 20% decreases in regional anthrop. NOx, CO, NMVOC emis. individually (4x3) regional anthrop. emis. of all O3 and aerosol precursors (4) global methane (to 1408 ppb) HTAP REGIONS A.M. Fiore
Large inter-model range; 21-model mean generally captures observed monthly mean surface O3 Many models biased low at altitude, high over EUS+Japan in summer Good springtime/late fall simulation Mediterranean Central Europe > 1km Central Europe < 1km NE USA SW USA SE USA Surface Ozone (ppb) Japan Mountainous W USA Great Lakes USA A.M. Fiore
Similar impact from 3 foreign regions Largest foreign S-R pair S(-20% foreign anthrop. emis.) -20% domestic anthrop. emis. = 0.45-0.75 EU NA EA “import sensitivity” SA Estimates of S-R relationships: Annual mean surface O3 decrease from 20% reductions in anthropogenic NOx+CO+NMVOC emissions Source region: sum of 3 foreign regions Full range of 15 individual models Receptor region: NA EU E Asia S Asia But… seasonality in sensitivity to domestic vs. foreign sources? A.M. Fiore
Model ensemble mean surface O3 response over NA to decreases in anthropogenic emissions of O3 precursors -20% anthrop. NOx+CO+NMVOC emis. # models = 15 # models = 15, 17, 14, 14 • Max foreign influence spring + late fall • SA contributes least • EU + EA contribute similarly Apr-Nov (but depends on model) • Max influence in summer (NOx) • Max NMVOC contribution in winter Import Sensitivity for NA in July ~ 0.2, in April ~ 0.6 A.M. Fiore
Model ensemble mean surface O3 response over NA to decreases in anthropogenic emissions of O3 precursors Model ensemble mean indicates a comparable influence from foreign NOx and NMVOC… …but relative importance varies across models Wide range in EU anthrop. NMVOC inventories used in the models large uncertainty in the estimated response of NA O3 to EU emissions Foreign impact on NA (sum of O3 responses to -20% anthrop. emis. in the 3 foreign regions) A.M. Fiore
Summary: Intercontinental S-R relationships for O3 and conventional O3 precursors • Identified robust estimates + key areas of uncertainty • Model ensemble mean overestimate vs. obs in summer EUS and Japan • Robust: NAEU largest; SAothers smallest • Uncertainty in relative roles of EU/EA NA • Uncertainty in exported EU O3 from EU AVOC emissions inventories Import sensitivities in other regions? Comparison with prior literature?
Surface O3 response to decreases in foreign anthropogenic emissions of O3 precursors Robust conclusions: • NA>EA>SA on EU ozone • NA and EU often > SA or EA on each other; dominant contributor varies across models Ozone over foreign regions generally least sensitive to SA emissions Import sensitivities during month of max. domestic or foreign sensitivity: EU: 0.7 (APR) 0.3 (JUL) EA: 1.1 (MAR) 0.2 (JUL) SA: 0.5 (NOV) A.M. Fiore
Range of published studies Range in this work Model ensemble median Range of estimated S-R relationships narrows from that in the literature with consistently applied HTAP approach Assume linearity, scale response to -20% to 100% to estimate total contribution Receptor = NA Receptor = EA Receptor = EU A.M. Fiore
Summary: Intercontinental S-R relationships for O3 and conventional O3 precursors • Identified robust estimates + key areas of uncertainty • Uncertainty in exported EU O3 from EU AVOC emissions inventories • Robust: NAEU largest; SAothers smallest • Uncertainty in relative roles of EU/EA NA; EU/NAEA/SA • Model ensemble mean overestimate vs. obs in summer EUS and Japan • Estimated “import sensitivities” • 0.2-0.3 July EA/NA/EU (max domestic production) • 0.6-0.9 April EA/NA/EU (max foreign influence) • 0.5 November SA (max foreign+domestic influence) • Narrowed range of estimates from that in the literature How does role of CH4 compare with NOx+CO+NMVOC?
Globally reducing methane decreases surface ozone everywhere 20% anth. NMVOC 20% anth. CO 20% anth. CH4 20% anth. NOx Change in population-weighted mean 8-hr daily max surface O3 in 3-month “O3 season” (ppbv) Number of U.S. summer grid-square days with O3 > 80 ppbv 1995 (base) 50% anth. VOC 50% anth. CH4 50% anth. NOx 2030 A1 2030 B1 Steady-state results from MOZART CTM GEOS-Chem results Fiore et al., GRL, 2002 West et al., GRL, 2007 Examine role of CH4 vs. NOx+CO+NMVOC in multi-model context
Surface ozone decreases similarly in all HTAP regions when global methane is reduced Full range of 18 individual models ppb Receptor: EU NA E Asia S Asia • ~1 ppbv O3 decrease over all NH receptor regions • Consistent with prior studies Can we scale these results to 20% reductions in regional anthrop. CH4 emissions to compare with conventional O3 precursors? A.M. Fiore
MOZART-2 [this work] MOZART-2 [West et al., 2006,2007] TM3 [Dentener et al., 2005] GISS [Shindell et al., 2005] GEOS-CHEM [Fiore et al., 2002] IPCC TAR [Prather et al., 2001] Harvard [Wang and Jacob, 1998] + X Tropospheric O3 responds approximately linearly to anthropogenic CH4 emission changes across models Anthropogenic CH4 contributes ~50 Tg (~15%) to tropospheric O3 burden ~5 ppbv to surface O3 Fiore et al., JGR, 2008
Sum of ozone decreases from 20% reductions in the 3 foreign regions ppb Receptor: NA EU E Asia S Asia Comparable annual mean O3 decrease from 20% reductions in foreign CH4 emissions and NOx+NMVOC+CO Use CH4 simulation + EDGAR 3.2 FT2000 CH4 emissions [Olivier et al., 2005] to estimate O3 response to -20% regional anthrop. CH4 emissions A.M. Fiore
Conclusions: Intercontinental S-R Relationships for O3 • Identified robust estimates + key areas of uncertainty • Model ensemble mean overestimate vs. obs in summer EUS and Japan • Robust: NAEU largest; SAothers smallest • Uncertainty in relative roles of EU/EA NA • Uncertainty in exported EU O3 from EU AVOC emissions inventories • Estimated “import sensitivities” • 0.2-0.3 July EA/NA/EU (max domestic production) • 0.6-0.9 April EA/NA/EU (max foreign influence) • 0.5 November SA (max foreign+domestic influence) • Narrowed range of estimates from that in the literature under HTAP setup • Combined reductions in regional anthropogenic CH4 + conventional O3 precursors roughly double the O3 decrease over foreign regions How might climate change affect hemispheric transport of air pollution? Are our S-R relationships consistent with rising Asian emissions driving a 0.1-0.5 ppb yr-1 surface O3 increase (as derived from observations)?
Global background ozone may decrease in a warmer, more humid climate Mean annual change in number of days where daily max 8-hr O3 > 80 ppbv (2090-2100 A1) – (1990-2000) Less trans-Pacific transport Increase in polluted (high-NOx) regions More inflow of clean air from Gulf of Mexico MOZART-2 global tropospheric chemistry model with meteorology from NCAR climate model [Murazaki and Hess, J. Geophys. Res., 2006] A.M. Fiore
OBSERVED: +0.1-0.5 ppb yr-1 in background surface O3 [TF HTAP, 2007] SPACE-BASED NO2NOx EMISSIONS ASIA: +40% Mace Head, Ireland Simmonds et al., 2004 Richter et al., 2005 NA West Coast Jaffe et al., 2003 Fig 3.6 from TF HTAP [2007] Apply S-R relationships to address hypothesis of rising background O3 driven by increasing Asian emissions Assuming +10% yr-1 Asian emissions, our results imply an O3 increase over NA and EU that falls at the low end of observed rise at the most OUR CAVEATS: -- assumes SA+EA, + other emissions follow NOx -- continental-avg vs. “west coast” obs A.M. Fiore