Download
1 / 27
270 likes | 372 Views
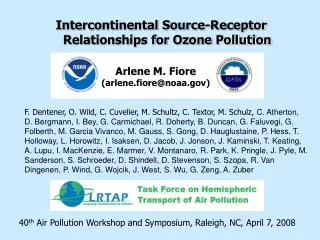
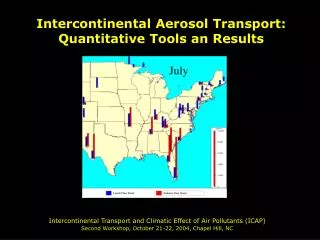
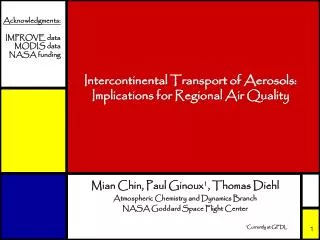
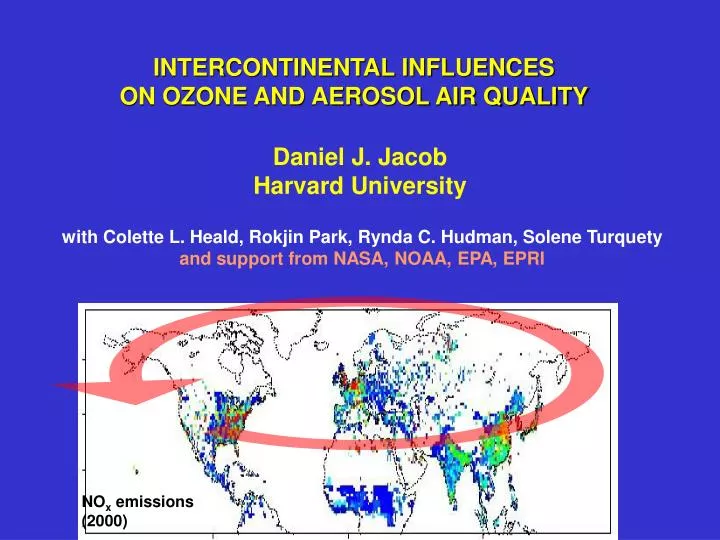
NO x emissions (2000). INTERCONTINENTAL INFLUENCES ON OZONE AND AEROSOL AIR QUALITY. Daniel J. Jacob Harvard University. with Colette L. Heald, Rokjin Park, Rynda C. Hudman, Solene Turquety and support from NASA, NOAA, EPA, EPRI. TREND IS TOWARD TIGHTER AIR QUALITY STANDARDS.

E N D
NOx emissions (2000) INTERCONTINENTAL INFLUENCESON OZONE AND AEROSOL AIR QUALITY Daniel J. Jacob Harvard University with Colette L. Heald, Rokjin Park, Rynda C. Hudman, Solene Turquety and support from NASA, NOAA, EPA, EPRI
TREND IS TOWARD TIGHTER AIR QUALITY STANDARDS Current 8-h average ozone standards: 84 pppbv (U.S.), 55 ppbv (EU) AOT40 ozone growing season standard for Europe: daytime ppb-hours above 40 ppbv over growing season AOT40 Standards: 10,000 ppbh (forests) 3,000 ppbh (crops) … correspond to mean ozone concentration of 41-45 ppbv EMEP [2005]
clean day moderately polluted day Anthropogenic emissions (illustrative) REGIONAL HAZE RULE IN THE UNITED STATES:national parks to achieve “natural visibility” by 2064 Acadia National Park, Maine visibility (deciviews) Schedule for implementation of Regional Haze Rule [U.S. EPA, 2001] 2004 2018 2064 YEAR
U.S. VISIBILITY IMPAIRMENT BY ASIAN DUST STORMS clear day April 16, 2001: Asian dust! Glen Canyon, Arizona … anthropogenic pollution is transported together with the dust Aerosol optical depth (AOD)Carbon monoxide (CO) MODIS satellite data model (dust) model (sulfate) MOPITT satellite data satellite data satellite data Colette Heald (Harvard)
PATHWAYS FOR INTERCONTINENTAL TRANSPORT Transparent arrows: transport in boundary layer below 2 km Colored arrows: transport in free troposphere Stohl and Eckhard [2004]
TWO MODES OF INTERCONTINENTAL INFLUENCE • Direct intercontinental transport: fast (~1 week) transport from source to receptor continent; either by boundary layer advection or by lifting to lower free • troposphere followed by subsidence • Hemispheric pollution: pollution mixes in free troposphere, affecting free tropospheric background, in turn affecting surface concentrations by subsidence Tropopause HEMISPHERIC POLLUTION BACKGROUND Mixing Free troposphere 2 km “Direct” intercontinental transport Boundary layer boundary layer advection lifting subsidence Asia N. America Europe
GLOBAL DISTRIBUTION OF TROPOSPERIC OZONE OBSERVED FROM THE GOME SATELLITE INSTRUMENT Mean JJA 1997 tropospheric columns (Dobson Units): circumpolar transport around northern midlatitudes pollution belt X. Liu, Harvard SAO/CFA
OZONE BACKGROUND AT NORTHERN MID-LATITUDES HAS A LARGE ANTHROPOGENIC COMPONENT 60 European 8-h std. Observations at free tropospheric mountain sites in Europe [Marenco et al., 1994] 50 AOT40 std 40 Preindustrial model ranges 30 20 10 stratospheric constribution 0 1870 1890 1910 1930 1950 1970 1990
GEOS-Chem GLOBAL 3-D MODELOF ATMOSPHERIC TRANSPORT AND CHEMISTRY • driven by GEOS assimilated meteorological observations from NASA Global Modeling and Assimilation Office (GMAO); native resolution 1ox1o( g 2ox2.5o), ~50 vertical levels • cross-tropopause transport constrained globally from observations (400 Tg O3 yr-1) • Coupled tropospheric ozone-aerosol chemistry (~100 interacting species) • Ozone precursors: • Nitrogen oxides (NOx): combustion, lightning, soils • Methane: wetlands, agriculture, natural gas, coal mining • Nonmethane volatile organic compounds (NMVOCs): • vegetation, combustion, industry • Carbon monoxide (CO): combustion, VOC oxidation • Aerosols and precursors: • Sulfur gases: combustion, oceans, volcanoes, biomass burning • Nitrogen oxides • Ammonia: agriculture, soils, biomass burning, oceans • Organic carbon (OC): biomass burning, vegetation, industry • Black carbon (BC): combustion • Soil dust, sea salt
MEAN SURFACE OZONE ENHANCEMENTS FROM ANTHROPOGENIC NOx AND NMVOC EMISSIONS IN DIFFERENT CONTINENTS as determined from sensitivity simulations with these sources shut off GEOS-Chem model, July 1997 North America Europe Asia Li et al. [2002]
INTERCONTINENTAL OZONE ENHANCEMENTS ARE LARGER IN FREE TROPOSPHERE THAN AT SURFACE Mean GEOS-Chem ozone enhancements at 45oN in summer from anthropogenic emissions of NOx and NMVOCs in different continents N. American emissions Europe Asia N America European emissions Asian emissions Li et al. [2002]
Subsidence of Asian pollution + local production stagnation tropical air SUMMERTIME VARIABILITY OF OZONE INTERCONTINENTAL POLLUTION ENHANCEMENT IN U.S. GEOS-Chem summer statistics of surface afternoon ozone enhancements from Asian and European emissions over ensemble of U.S. surface sites Effect is maximum for ozone concentrations in mid-range (40-70 ppbv) Fiore et al. [2002]
EFFECT OF NORTH AMERICAN SOURCESON EXCEEDANCES OF EUROPEAN AIR QUALITY STANDARD (55 ppbv, 8-h average) GEOS-CHEM model results, summer 1997 Number of exceedance days (out of 92) # of exceedance days that would not have been in absence of N.American emissions Li et al. [2002]
PROBING TRANSPACIFIC POLLUTION TRANSPORT NOAA/ITCT-2K2 aircraft campaign, April-May 2002 High-ozone Asian pollution plumes and stratospheric influence observed in lower free troposphere … but not at surface Observations by D. Parrish, J. Roberts, T. Ryesrson (NOAA/AL) May 5 plume at 6 km: High CO and PAN, no O3 enhancement CO O3 PAN May 17 subsiding plume at 2.5 km: High CO and O3, PAN gNOxgHNO3 HNO3 Hudman et al. [2004]
Subsidence Over E Pacific OPE 60-80 PAN gNOxgHNO3 PAN NOx HNO3 CONCEPTUAL PICTURE OF OZONE PRODUCTIONIN TRANSPACIFIC ASIAN POLLUTION PLUMES GEOS-CHEM ozone production efficiency (2-4 km) Hudman et al. [2004] Stratospheric downwelling Warm conveyor belt; 5-10% export of NOy mainly as PAN PAN, weak DO3 strong DO3 Asian boundary layer (OPE ~ 5) U.S. boundary layer 10x dilution (Asian dust data) DO3 = 6 ± 2 ppbv (California) E. Asia Pacific United States
CALIFORNIA MOUNTAIN SITES ARE MOST SENSITIVE TO ASIAN OZONE POLLUTION…because there is less dilution Observed 8-h ozone at Sequoia National Park (1800 m) in May 2002 vs. corresponding simulated (GEOS-CHEM) Asian pollution ozone enhancement May 17 obs. Asian plume event in red Asian enhancements are 6-10 ppbv during exceedances of standard; unlike at surface sites, Asian pollution influence is not minimum under high-ozone conditions! Hudman et al. [2004]
ICARTT: COORDINATED ATMOSPHERIC CHEMISTRY CAMPAIGN OVER EASTERN NORTH AMERICA AND NORTH ATLANTIC IN SUMMER 2004 ERS ERS-2 Envisat Terra Aqua SCIAMACHY GOME AIRS, MODIS MISR, MODIS, MOPITT NOAA-P3 DOE G-1 DLR Falcon NASA DC-8 UK BAE-143 NASA Proteus International, multi-agency (U.S.) collaboration targeted at U.S. regional air quality, pollution outflow, transatlantic transport, aerosol radiative forcing
AIRS CO SATELLITE OBSERVATIONSOF INTERCONTINENTAL TRANSPORT DURING ICARTT Carbon monoxide (CO) columns on July 18 Alaskan fires U.S. pollution Asian pollution Wallace McMillan (UMBC)
ASIAN POLLUTION PLUME OVER EASTERN U.S. GEOS forecast Asian CO (9 km) Observed O3 (ppbv) Observed CO(ppbv) sampled by NASA aircraft on July 15 Observed O3 = 20-40 ppbv, CO = 20 ppbv GEOS-Chem O3 = 5-10 ppbv, CO = 10-20 ppbv High Halon-1211 in plume confirms Asian origin
TRANSPACIFIC TRANSPORT OF AEROSOLS MODIS satellite observations of aerosol optical depth (AOD) in different seasons, and corresponding GEOS-Chem model simulations MODIS AOD GEOS-CHEM AOD: Asian anthrop. Dust DJF MAM JJA SON Colette L. Heald, Harvard
AIRCRAFT OBSERVATIONS IN ASIAN WARM CONVEYOR BELT (WCB) OUTFLOW ILLUSTRATE SCAVENGING OF AEROSOLS DURING LIFTING TO FREE TROPOSPHERE TRACE-P campaign out of Hong Kong and Japan, spring 2001 boundary layer outflow Aerosols scavenged from WCB outflow Ozone: WCB outflow WCB outflow Longitude Data from E.V. Browell
SCAVENGING OF AEROSOLS INCLUDING BLACK CARBON (BC) APPARENT IN MEAN VERTICAL PROFILES P3B DATA over NW Pacific (30 – 45oN, 120 – 140oE) TRACE-P observations over NW Pacific and GEOS-Chem simulations Sulfate is most important exported anthropogenic aerosol in model Park et al. [2005]
ACE-Asia aircraft observations over Japan (spring 2001) MYSTERY ORGANIC AEROSOL IN HIGH-ALTITUDEASIAN OUTFLOW (A.D. Clarke) • implies large secondary production in free troposphere not included in present models; • Dominates aerosol loading in free troposphere; • could produce large negative radiative forcing effect (~ 1W m-2) Elemental carbon (EC) observed GEOS-Chem Organic carbon (OC) Organic carbon (OC) Colette Heald (Harvard)
INTERCONTINENTAL TRANSPORT OF ASIAN AND NORTH AMERICAN ANTHROPOGENIC SULFATE As determined from GEOS-Chem 2001 sensitivity simulations with these sources shut off Intercontinental enhancements of anthropogenic sulfate over U.S. are of same order as interstate enhancement threshold used for regulation (0.2 mg m-3) and higher than EPA estimates of natural values (0.1 mg m-3)
VERTICAL STRUCTURE OF TRANSPACIFIC TRANSPORT GEOS-Chem model results for spring 2001 (15-45oN) Asian CO Asian sulfate N. America N. America Asia Asia Asian aerosols are transported in lower free troposphere and subside over the NE Pacific; topography in western U.S. promotes contact with surface C.L. Heald, Harvard
IMPROVE GEOS-CHEM Asian anthr (GEOS-Chem) EVIDENCE OF ASIAN SULFATE IN IMPROVE NETWORKOF AEROSOL MEASUREMENTS AT U.S. SITES GEOS-Chem Asian influence spring 2001 mean 24-h seasonal max NW US: 0.60 μgm-3 NW US: 0.18 μgm-3 1.4 mg m-3 Time series over NW U.S. (spring 01) March 1 April 1 May 1 June 1 spring 2001 mean days of GEOS-Chem 24-h seasonal max IMPROVE data: NW US: 1.04 μgm-3 NW US: 0.72 μgm-3
Janus mission proposed to NASA:GLOBAL MAPPING OF ATMOSPHERIC COMPOSITION FROM L1 ORBIT Global mapping of tropospheric aerosols, clouds, NO2, HCHO, SO2, CO, CO2: observe transport on regional to global scales Continuous observation of Earth’s sunlit disk with 5 km nadir horizontal resolution