Download
1 / 1
10 likes | 127 Views
Fig.1. RBS and ERDA measurements. inputs. Results. ANN. NDF. outputs. Training process. Train Set Test Set. Fig.3. Fig.2. ARTIFICIAL NEURAL NETWORK ANALYSIS OF MULTIPLE IBA SPECTRA. H.F.R.Pinho 1,2 , A. Vieira 2 , N.R.Nen é 1 , N. P. Barradas 1,3

E N D
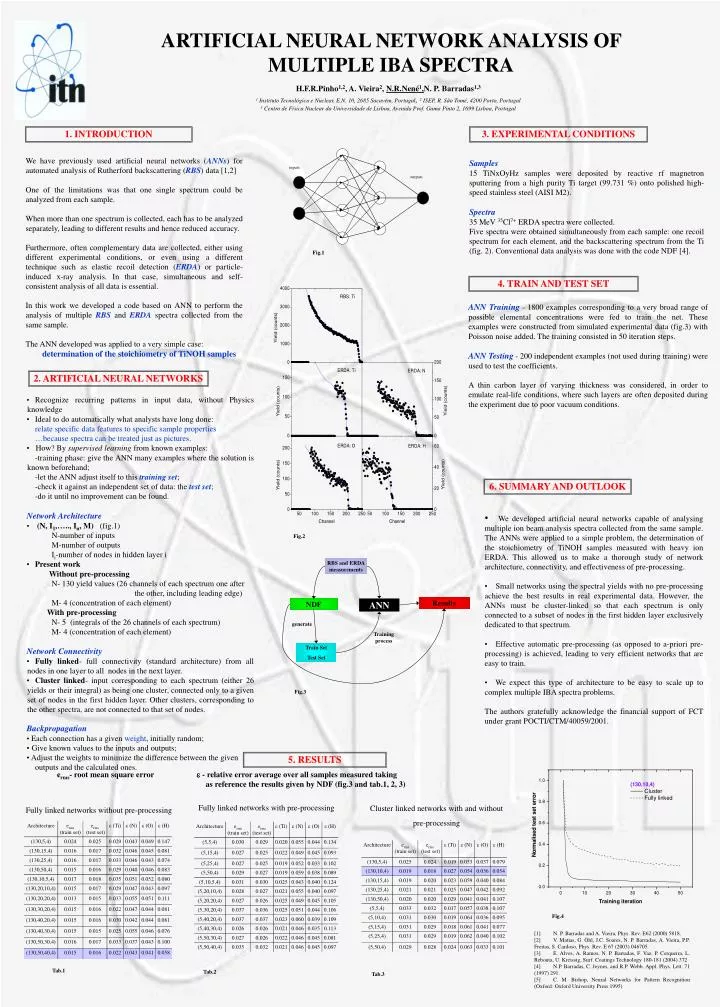
Fig.1 RBS and ERDA measurements inputs Results ANN NDF outputs Training process Train Set Test Set Fig.3 Fig.2 ARTIFICIAL NEURAL NETWORK ANALYSIS OF MULTIPLE IBA SPECTRA H.F.R.Pinho1,2, A. Vieira2, N.R.Nené1,N. P. Barradas1,3 1 Instituto Tecnológico e Nuclear, E.N. 10, 2685 Sacavém, Portugal, 2 ISEP, R. São Tomé, 4200 Porto, Portugal 3 Centro de Física Nuclear da Universidade de Lisboa, Avenida Prof. Gama Pinto 2, 1699 Lisboa, Portugal 1. INTRODUCTION 3. EXPERIMENTAL CONDITIONS We have previously used artificial neural networks (ANNs) for automated analysis of Rutherford backscattering (RBS) data [1,2] One of the limitations was that one single spectrum could be analyzed from each sample. When more than one spectrum is collected, each has to be analyzed separately, leading to different results and hence reduced accuracy. Furthermore, often complementary data are collected, either using different experimental conditions, or even using a different technique such as elastic recoil detection (ERDA) or particle-induced x-ray analysis. In that case, simultaneous and self-consistent analysis of all data is essential. In this work we developed a code based on ANN to perform the analysis of multiple RBS and ERDA spectra collected from the same sample. The ANN developed was applied to a very simple case: determination of the stoichiometry of TiNOH samples • Samples • 15 TiNxOyHz samples were deposited by reactive rf magnetron sputtering from a high purity Ti target (99.731 %) onto polished high-speed stainless steel (AISI M2). • Spectra • 35 MeV 35Cl7+ ERDA spectra were collected. • Five spectra were obtained simultaneously from each sample: one recoil spectrum for each element, and the backscattering spectrum from the Ti (fig. 2). Conventional data analysis was done with the code NDF [4]. 4. TRAIN AND TEST SET ANN Training - 1800 examples corresponding to a very broad range of possible elemental concentrations were fed to train the net. These examples were constructed from simulated experimental data (fig.3) with Poisson noise added. The training consisted in 50 iteration steps. ANN Testing - 200 independent examples (not used during training) were used to test the coefficients. A thin carbon layer of varying thickness was considered, in order to emulate real-life conditions, where such layers are often deposited during the experiment due to poor vacuum conditions. 2. ARTIFICIAL NEURAL NETWORKS • Recognize recurring patterns in input data, without Physics knowledge • Ideal to do automatically what analysts have long done: • relate specific data features to specific sample properties • …because spectra can be treated just as pictures. • How? By supervised learning from known examples: • -training phase: give the ANN many examples where the solution is known beforehand; • -let the ANN adjust itself to this training set; • -check it against an independent set of data: the test set; • -do it until no improvement can be found. • Network Architecture • (N, I1,….., In, M) (fig.1) • N-number of inputs • M-number of outputs • Ii-number of nodes in hidden layer i • Present work • Without pre-processing • N- 130 yield values (26 channels of each spectrum one after the other, including leading edge) • M- 4 (concentration of each element) • With pre-processing • N- 5 (integrals of the 26 channels of each spectrum) • M- 4 (concentration of each element) • Network Connectivity • Fully linked- full connectivity (standard architecture) from all nodes in one layer to all nodes in the next layer. • Cluster linked- input corresponding to each spectrum (either 26 yields or their integral) as being one cluster, connected only to a given set of nodes in the first hidden layer. Other clusters, corresponding to the other spectra, are not connected to that set of nodes. • Backpropagation • Each connection has a given weight, initially random; • Give known values to the inputs and outputs; • Adjust the weights to minimize the difference between the given outputs and the calculated ones. 6. SUMMARY AND OUTLOOK • We developed artificial neural networks capable of analysing multiple ion beam analysis spectra collected from the same sample. The ANNs were applied to a simple problem, the determination of the stoichiometry of TiNOH samples measured with heavy ion ERDA. This allowed us to make a thorough study of network architecture, connectivity, and effectiveness of pre-processing. • Small networks using the spectral yields with no pre-processing achieve the best results in real experimental data. However, the ANNs must be cluster-linked so that each spectrum is only connected to a subset of nodes in the first hidden layer exclusively dedicated to that spectrum. • Effective automatic pre-processing (as opposed to a-priori pre-processing) is achieved, leading to very efficient networks that are easy to train. • We expect this type of architecture to be easy to scale up to complex multiple IBA spectra problems. • The authors gratefully acknowledge the financial support of FCT under grant POCTI/CTM/40059/2001. generate 5. RESULTS erms- root mean square error - relative error average over all samples measured taking as reference the results given by NDF (fig.3 and tab.1, 2, 3) Fully linked networks with pre-processing Cluster linked networks with and without pre-processing Fully linked networks without pre-processing Fig.4 [1] N. P. Barradas and A. Vieira, Phys. Rev. E62 (2000) 5818. [2] V. Matias, G. Öhl, J.C. Soares, N. P. Barradas, A. Vieira, P.P. Freitas, S. Cardoso, Phys. Rev. E 67 (2003) 046705. [3] E. Alves, A. Ramos, N. P. Barradas, F. Vaz, P. Cerqueira, L. Rebouta, U. Kreissig, Surf. Coatings Technology 180-181 (2004) 372 [4] N.P. Barradas, C. Jeynes, and R.P. Webb, Appl. Phys. Lett. 71 (1997) 291. [5] C. M. Bishop, Neural Networks for Pattern Recognition (Oxford: Oxford University Press 1995) Tab.1 Tab.2 Tab.3