Download
1 / 37
370 likes | 473 Views
Future Directions of the VO. Alex Szalay The Johns Hopkins University Jim Gray Microsoft Research. Living in an Exponential World. Astronomers have a few hundred TB now 1 pixel (byte) / sq arc second ~ 4TB Multi-spectral, temporal, … → 1PB

E N D
Future Directions of the VO Alex SzalayThe Johns Hopkins University Jim GrayMicrosoft Research
Living in an Exponential World • Astronomers have a few hundred TB now • 1 pixel (byte) / sq arc second ~ 4TB • Multi-spectral, temporal, … → 1PB • They mine it looking fornew (kinds of) objects or more of interesting ones (quasars), density variations in 400-D space correlations in 400-D space • Data doubles every year
The Challenges Exponential data growth: Distributed collections Soon Petabytes Data Collection Discovery and Analysis Publishing New analysis paradigm: Data federations, Move analysis to data New publishing paradigm: Scientists are publishers and Curators
Roles Authors Publishers Curators Consumers Traditional Scientists Journals Libraries Scientists Emerging Collaborations Project www site Bigger Archives Scientists Publishing Data • Exponential growth: • Projects last at least 3-5 years • Data sent upwards only at the end of the project • Data will never be centralized • More responsibility on projects • Becoming Publishers and Curators • Data will reside with projects • Analyses must be close to the data
Accessing Data • If there is too much data to move around, take the analysis to the data! • Do all data manipulations at database • Build custom procedures and functions in the database • Automatic parallelism guaranteed • Easy to build-in custom functionality • Databases & Procedures being unified • Example temporal and spatial indexing • Pixel processing • Easy to reorganize the data • Multiple views, each optimal for certain analyses • Building hierarchical summaries are trivial • Scalable to Petabyte datasets active databases!
Next-Generation Data Analysis • Looking for • Needles in haystacks – the Higgs particle • Haystacks: Dark matter, Dark energy • Needles are easier than haystacks • ‘Optimal’ statistics have poor scaling • Correlation functions are N2, likelihood techniques N3 • For large data sets main errors are not statistical • As data and computers grow with Moore’s Law, we can only keep up with N logN • A way out? • Discard notion of optimal (data is fuzzy, answers are approximate) • Don’t assume infinite computational resources or memory • Requires combination of statistics & computer science
Why Is Astronomy Special? • Especially attractive for the wide public • Community is not very large • It has no commercial value • No privacy concerns, freely share results with others • Great for experimenting with algorithms • It is real and well documented • High-dimensional (with confidence intervals) • Spatial, temporal • Diverse and distributed • Many different instruments from many different places and many different times • The questions are interesting • There is a lot of it (soon petabytes)
The Virtual Observatory • Premise: most data is (or could be online) • The Internet is the world’s best telescope: • It has data on every part of the sky • In every measured spectral band: optical, x-ray, radio.. • As deep as the best instruments (2 years ago). • It is up when you are up • The “seeing” is always great • It’s a smart telescope: links objects and data to literature on them • Software became the capital expense • Share, standardize, reuse..
Sloan Digital Sky Survey Goal Create the most detailed map of the Northern sky “The Cosmic Genome Project” Two surveys in one Photometric survey in 5 bands Spectroscopic redshift survey Automated data reduction 150 man-years of development High data volume 40 TB of raw data 5 TB processed catalogs Data is public The University of Chicago Princeton University The Johns Hopkins University The University of Washington New Mexico State University Fermi National Accelerator Laboratory US Naval Observatory The Japanese Participation Group The Institute for Advanced Study Max Planck Inst, Heidelberg Sloan Foundation, NSF, DOE, NASA
The Imaging Survey Drift scan of 10,000 square degrees 24k x 1M pixel “panoramic” images in 5 colors – broad-band filters (u,g,r,i,z) 2.5 Terapixels of images
Precision Cosmology Power Spectrum of Fluctuationsfew percent accuracy! Main challenge: with so much data the dominant errors are systematic, not statistical! Using large simulations to understand significance of detection
SkyServer • Sloan Digital Sky Survey: Pixels + Objects • About 500 attributes per “object”, 400M objects • Currently 2.4TB fully public • Prototype eScience lab (800 users) CasJobs • Moving analysis to the data • Visual tools • Join pixels with objects
Wireless Sensor Networks • Collaboration with K. Szlavecz, A. Terzis, J. Gray, S. Ozer • Building 200 node network to measure soil moisture for environmental monitoring • Expect 200 million measurements /yr • Deriving from the SkyServer template we were able to build and end-to-end system in less than two weeks • Built a OLAP datacube, conditional sums along multiple dimensional axes http://lifeunderyourfeet.org/
Sociological Challenges • How to avoid trying to be everything for everybody? • Rapidly changing “outside world” • Make it simple!!! • Publishing: • Exponential linear • Data reliability credits and career paths
Where are we going? • Relatively easy to predict until 2010 • Exponential growth continues • Most ground based observatories join the VO • More and more sky surveys in different wavebands • Simulations will have VO interfaces: can be ‘observed’ • Much harder beyond 2010 • PetaSurveys are coming on line (PanSTarrs, VISTA, LSST) • Technological predictions much harder • Changing funding climate • Changing sociology
HEP Van de Graaf Cyclotrons National Labs International Labs SSC vs LHC Optical Astronomy 2.5m telescopes 4m telescopes 8-10m class telescopes Surveys/Time Domain 30-100m telescopes Similarities to HEP • Similar trends with a 20 year delay, • fewer and ever bigger projects… • increasing fraction of cost is in software… • more conservative engineering… • Can the exponential trend continue, or will be logistic? • What can astronomy learn from High Energy Physics?
But: Why Is Astronomy Different? • Especially attractive for the wide public • Data has more dimensions • Spatial, temporal, cross-correlations • Diverse and distributed • Many different instruments from many different places and many different times • A broad distribution of different questions!
Future How long does the data growth continue? • High end always linear • Exponential comes from technology + economics rapidly changing generations • like CCD’s replacing plates, and become ever cheaper • How many new generations of instruments do we have left? • Software is also an instrument • hierarchical data replication • virtual data • data cloning
Technology+Sociology+Economics • Neither of them is enough • We have technology changing very rapidly • Google, tags, sensors, Moore's Law • Trend driven by changing generations of technologies • Sociology is changing in unpredictable ways • In general, people will use a new technology if it is • Offers something entirely new • Or substantially cheaper • Or substantially simpler • Funding is essentially level
Tale of the Tails • Long tailed distributions • Pareto: 20% of population holds 80% of wealth • Zipf: word frequency follows a power law • C. Anderson: everything on the web is a power law • Lognormal vs Gaussian • Multiplicative processes lead to lognormal Log P = Log p1 + Log p2 + … + Log pn … • Central limit theorem: Log P is a normal random var • Kapteyn: random fragmentation • Lognormal resembles a 1/f over large dynamic range • Extremely important in web-based economics • Amazon, Time-Warner, blogs, etc
Power Laws • Barabasi: Power laws tend to arise in social systemswhere people are faced with many choices • The more choices, distribution more extreme • Measured by the distance between #1 and the median • Most elements in the power law system are below the average • People’s choices affect one another, they are not random independent events
Examples: the Grid • The size of computational problems is multiplicative • Has to have a lognormal distribution • Computers bought for the average job will not be large enough in the tail, but the system is still often idel • Need to borrow CPU for large jobs and loan when idle M. Ripeanu (UC): Top 500 computers
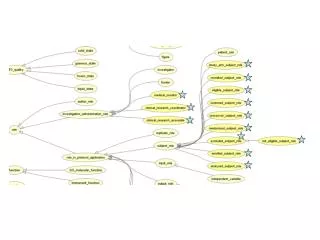
SkyServer tables Footprints and Cardinalities S. Lubow (STScI)
Analyzing the SkyServer • Prototype in data publishing • 200 million web hits in 5 years • 1,000,000 distinct usersvs 10,000 astronomers http://skyserver.sdss.org/
SkyServer Web and SQL Traffic Vic Singh (Stanford/ MSR)
Skyserver Sessions Vic Singh (Stanford/ MSR)
Human Pageviews by Organization Vic Singh (Stanford/ MSR)
SQL Traffic Vic Singh (Stanford/ MSR)
Data Sharing in the NVO • Users are more willing to part with their data if machine obtained • What is the business model? • Three tiers (power law!!!) (a) big surveys (b) value added, refereed products (c) mode ad-hoc data, images, outreach info • largely done (a) • need “Journal for Data” to solve (b) • need “VO-Flickr” and an integrated environment for virtual excursions for (c)
EDR DR1 DR1 DR2 DR2 DR2 DR3 DR3 DR3 DR3 Data Reliability • Is new data necessary better? • Yes: more of it, better calibrations • But: always on the edge • Usage of old data: changing into a power law • (CNN, Time-Warner) • Data publishing: once published, must stay • SDSS: DR1 is still used
VO Trends • VO is inevitable, a new way of doing science • Present on every physical scale today, not just astronomy (NEON, Neptune, CERN, MS) • Driven by advances in technology, and economics, mapped onto society • Boundary conditions: funding will be at best level • Computational methods, algorithmic thinking will come just as naturally as mathematics today
VO Technology • We will have Petabytes • We will need to save them, move them • several big archive centers connected • Need Journal for Data • curation is the key • Always will be an open-ended modular system • Archives -- also computational services • driven by economics: cheaper to process than move
VO Economics • The Price of Software • 30% from SDSS, 50% for LSST • should there be full reuse vs no reuse today? • neither: we are not systems integrators • risks and benefits are power law • repurpose for other disciplines is an example • The Price of Data • $100,000 /paper (Norris etal) • Drives new projects • For SDSS there are 1300 refereed papers for $100M so far • Level budgets
VO Sociology • Learn from particle physics • do not for granted that there will be a next one • small is beautiful • What happens to the rest of astronomy after the world's biggest telescope? • The impact of power laws: • we need to look at problems in octaves • the astronomers may be the tail of our users • there is never a natural end or an edge (except for our funding)
The Changing VO • Boundary conditions change, we need to change every year! • We must change at least as fast as the outside world or we will be left behind • We will make mistakes! We need to recognize and recover from them, step back and do it differently • If we do not make mistakes, we are not taking enough risks • But: we need to buffer/dampen these changes to the community
The Future of the VO • Does not have much of a past… • We need to keep running forward • We must take risks • Technology driving Sociology - limited by Economics • Everything is a power law – do not make assumptions! • Enormous potential • May be the only way to do 'small science' in 2020
Summary • Data growing exponentially • Analyzing so much data requires a new model • More data coming: Petabytes/year by 2010 • Need scalable solutions • Move analysis to the data • Spatial and temporal features essential • 20 queries! • Data explosion is coming from inexpensive sensors • Same thing happening in all sciences • High energy physics, genomics, cancer research,medical imaging, oceanography, remote sensing, … • eScience: an emerging new branch of science