Download
1 / 34
420 likes | 1.07k Views
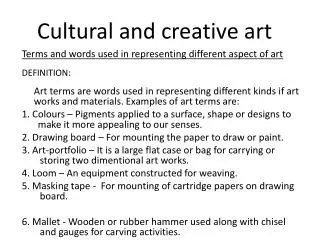
Creative and Cultural Industry. Impact and Footprint. Definition of the Creative and Cultural Industry. Creative & Cultural Skills defines the creative and cultural industry as including the following: Advertising Craft Cultural Heritage Design Literature Music Performing Arts

E N D
Creative and Cultural Industry Impact and Footprint
Definition of the Creative and Cultural Industry Creative & Cultural Skills defines the creative and cultural industry as including the following: • Advertising • Craft • Cultural Heritage • Design • Literature • Music • Performing Arts • Visual Arts Creative and cultural industry
Employment in Creative and Cultural Industry • Total employment: 678,480 • Design is the largest industry in employment terms in the creative and cultural industries • Employment in the industries has increased by 9% between 2006 and 2008 Creative and cultural industry
Employment change in Creative and Cultural Industry • Employment in the industries has increased by 9% between 2006 and 2008 • This differs by industry sector Creative and cultural industry
Creative and Cultural Industry by Region • 88% of people working in the industry are in England, 7% in Scotland, 4% in Wales and 2% in Northern Ireland Creative and cultural industry
Change in Creative and Cultural Industry by Region • Employment in the creative and cultural industries increase by 9% between 2006 and 2008 • This employment change differs by geographic region Creative and cultural industry
Qualification Levels • 54% of people working in the creative and cultural industry have at least a level 4 qualification • Nearly a third (31%) have a level 2 or 3 qualification Creative and cultural industry
Wages • 62% of people working in the industry earn less than £20,000 • 1 in 10 earn more than £41,000 Creative and cultural industry
Gross Value Added • Creative and cultural industries contribute £24.8B GVA to the UK economy each year • GVA per employee is £36,570 Productivity levels: These statistics are based solely on an economic understanding of productivity. Our largely commercial sectors have a high GVA as a result, whereas sectors which are predominately subsidised (such as Cultural Heritage) will base productivity levels on other definitions (social inclusion, community etc) Creative and cultural industry
GVA Per Individual in Creative and Cultural Sector • Creative and cultural industries contribute £24.8B GVA to the UK economy each year • GVA per head differs by industry Productivity levels: These statistics are based solely on an economic understanding of productivity. Our largely commercial sectors have a high GVA as a result, whereas sectors which are predominately subsidised (such as Cultural Heritage) will base productivity levels on other definitions (social inclusion, community etc) Creative and cultural industry
Change in GVA • There has been a 7% decline in GVA across the creative and cultural industries in the UK • Music (-31%) and Advertising (-24%) have contributed significantly to this decline • The performing arts and design and cultural heritage have a higher GVA than in 2006/07 Productivity levels: These statistics are based solely on an economic understanding of productivity. Our largely commercial sectors have a high GVA as a result, whereas sectors which are predominately subsidised (such as Cultural Heritage) will base productivity levels on other definitions (social inclusion, community etc) Creative and cultural industry
Self Employed • 59% are employees, 41% self employed • There are significant differences among the different sectors Creative and cultural industry
Self Employed by Region • 59% are employees, 41% self employed • This differs depending on the employment area (see graph below) Creative and cultural industry
Change in Self Employment • Figures for both those in employment and those who are self employed have risen between 06/07 and 08/09 (7% and 11% respectively) • The visual arts have experienced the largest increase in self employment (30%), cultural heritage the largest decrease (-42%) Creative and cultural industry
Self Employed by Qualification Level • Self employed workers are more likely (57%) to have a level 4 or above qualification than employed workers (50%) Creative and cultural industry
Full and Part Time Work • 27% of people in the creative and cultural industries work on a part time basis • 20% of those working part time are in the performing arts industry Creative and cultural industry
Full and Part Time Work • 27% of people in the creative and cultural industries work on a part time basis • Nearly 40% of the those working in visual arts do so on a part time basis Creative and cultural industry
Full and Part Time Work Region • 27% of people in the creative and cultural industry work on a part time basis • This varies across geographic region (see graph below) Creative and cultural industry
Change in Full and Part Time Work • While the creative and cultural industries have grown by 9% since 06/07 part time work has grown by 28% (nearly 10 times the rate of employment growth in full time work) • Visual arts have seen the most growth in part time work Creative and cultural industry
Full and Part Time Work by Qualification Level • 54% of full time workers have a level 4 or above qualification compared to 49% of part time workers • 12% of part time workers have below level 2 as their highest qualification compared to 8% of full time workers Creative and cultural industry
Full and Part Time Work by Wage • 70% of part time workers earn less than £10,000 per annum compared to 14% of full time workers • Only 8% of part time workers earn more than £20,000 per annum compared to 51% of full time workers Creative and cultural industry
There is a majority of male workers (60%) This varies by creative and cultural industry Gender Creative and cultural industry
There is a majority of male workers (60%) This varies by geographic region Gender by Region Creative and cultural industry
Employment in the creative and cultural industries has increased by 9% between 06/07 and 08/09 The number of women in the industry as grown by 13% during this period, more than double the growth experienced in male employment Change in Gender Employment Creative and cultural industry
Women (51%) are more likely to have a qualification above level 4 than men (43%) Gender by Qualification Level Creative and cultural industry
70% of women in the industry earn less than £20,000 compared to 57% of men 11% of women earn £29,000 or more compared to 26% of men Gender by Wage Creative and cultural industry
Ethnicity • 93% of the cultural industry is white, this varies little across sector Creative and cultural industry
Ethnicity by Region • 93% of the industry is white • There are minor differences across geographic areas Creative and cultural industry
Change in Ethnic Employment • The number of Asian or Asian people in the sector has increase dramatically (118%), well over ten times the growth in employment experienced across the industry as a whole (9%) Creative and cultural industry
Ethnicity by Qualification Level • Depending on ethnic background, there are large differences in educational attainment Creative and cultural industry
Age of the Workforce • Over half (54%) of the creative and cultural industries are below the age of 40 • The largest single age group is 25-29 (15%) Creative and cultural industry
Businesses by Employment Size • There are 74,640 businesses in the creative and cultural industries • 87% of them employ less than 10 people • However, in some sector there is a propensity for larger businesses • 34% of Advertising businesses employ more than 50 people • 23% of Cultural Heritage organisations employ more than 50 people Creative and cultural industry
Businesses by Turnover Size • 7% of creative and cultural businesses have a turnover of more than £1M per year Creative and cultural industry
Disclaimer • The Creative and Cultural Industries Economic & Demographic Footprint research was conducted by the Creative & Cultural Skills in 2008 and is based on data collected from various sources in 2006. • The data contained within this presentation is drawn from: • Annual Population Survey data (2006): All aspects of employment, • The Inter-Departmental Business Register (2007): Business turnover and employment size bands data, • The Annual Business Inquiry (2006): Levels of Gross Value Added • Disclaimer: Figures and estimates below 100 are not as robust as larger sample data; all data presented is rounded to the nearest 5, or 0, figures for each variable may not always add up to the total figure presented. Creative and cultural industry