Download
1 / 2
20 likes | 127 Views
Premature Mortality in Eastern North Carolina 2002 to 2006. Years of Life Lost before the Age of 75. Years of Life Lost per 10,000 Population (Ratio to NC’s 2002 to 2006 5-Yr YLL). If a state… ENC would rank 47 th. 553.2 to 614.9 (0.67 – 0.75). ENC: 955.7 years (2004).

E N D
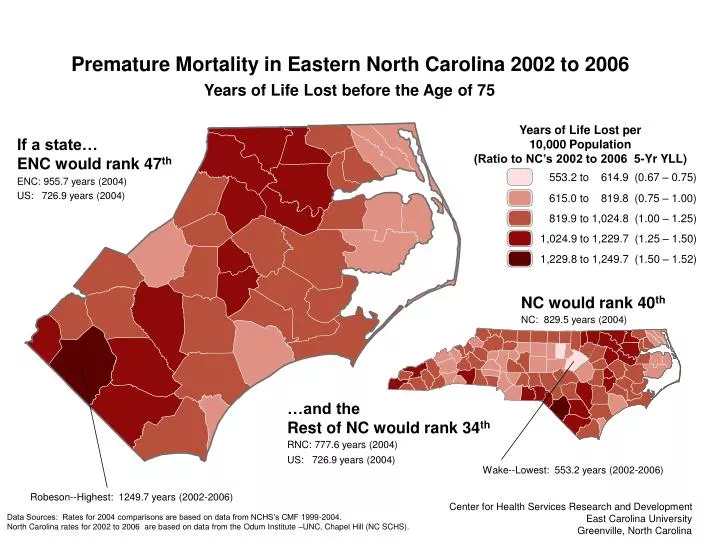
Premature Mortality in Eastern North Carolina 2002 to 2006 Years of Life Lost before the Age of 75 Years of Life Lost per 10,000 Population (Ratio to NC’s 2002 to 2006 5-Yr YLL) If a state… ENC would rank 47th 553.2 to 614.9 (0.67 – 0.75) ENC: 955.7 years (2004) US: 726.9 years (2004) 615.0 to 819.8 (0.75 – 1.00) 819.9 to 1,024.8 (1.00 – 1.25) 1,024.9 to 1,229.7 (1.25 – 1.50) 1,229.8 to 1,249.7 (1.50 – 1.52) NC would rank 40th NC: 829.5 years (2004) …and the Rest of NC would rank 34th RNC: 777.6 years (2004) US: 726.9 years (2004) Wake--Lowest: 553.2 years (2002-2006) Robeson--Highest: 1249.7 years (2002-2006) Center for Health Services Research and Development East Carolina University Greenville, North Carolina Data Sources: Rates for 2004 comparisons are based on data from NCHS’s CMF 1999-2004. North Carolina rates for 2002 to 2006 are based on data from the Odum Institute –UNC, Chapel Hill (NC SCHS).
0.0 to 375.5 (LTE 0.50) 375.6 to 563.3 (0.50 – 0.75) 563.4 to 751.0 (0.75 – 1.00) 751.1 to 938.8 (1.00 – 1.25) 938.9 to 1,126.6 (1.25 – 1.50) 1,126.7 to 1,314.3 (1.50 – 1.75) 1,314.4 to 1,502.1 (1.75 – 2.00) 1,502.2 to 2,634.9 (GT 2.00) Premature Mortality in the United States 2000 to 2004 Years of Life Lost before the Age of 75 Years of Life Lost per 10,000 Population (Ratio to US’s 2002 1-yr YLL) US YLL-75 2002: 751.04 Center for Health Services Research and Development East Carolina University Greenville, North Carolina Data Sources: NCHS’s Compressed Mortality Files (1999-2004)