Download
1 / 24
240 likes | 352 Views
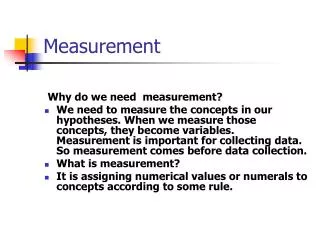
Measurement: the why and the what. Susanne Salem-Schatz, Sc.D Project Director Massachusetts Coalition for the Prevention of Medical Errors. Why measure?. For you Track progress towards key improvement goals “How do we know a change is an improvement?” What gets measured gets done

E N D
Measurement: the why and the what Susanne Salem-Schatz, Sc.D Project Director Massachusetts Coalition for the Prevention of Medical Errors
Why measure? • For you • Track progress towards key improvement goals • “How do we know a change is an improvement?” • What gets measured gets done • For us • Your experience and progress are a key component of how we evaluate our efforts (surveys, lessons shared on monthly reports, measures over time) • For the CDC (our funder) • National recognition • Continued funding and opportunity to support change in the community
What to measure • Limited set of core metrics • Differences by type of facility, when appropriate • Good enough • Balance value and effort • Don’t let the perfect be the enemy of the good
Overview of measures: Long term care • Percent of treated UTIs that meet the “Protocol criteria” (ABCs) • Rates* over time of: • new UTI cases • laboratory orders for urine culture • healthcare acquired C. difficile (HA-CDI) * All rates calculated per 10,000 resident days
Overview of measures: Emergency Department • Percent of treated UTIs with specific signs or symptoms of UTI • Percent of treated UTIs with non-specific signs or symptoms • Percent of treated UTIs with no signs or symptoms (default) • Rate of urine tests sent to laboratory per ED visitors > 70 years old
Measuring Progress Nora McElroy, MPH General Epidemiologist Massachusetts Department of Public Health Bureau of Infectious Disease Prevention, Response and Services, Epidemiology Program
Measuring Improvement • Establish baseline UTI rates and chart attributes • Record which LTC patients have been treated for UTIs and whether they fit the protocol definition in long term care facilities • Record the number and attributes of diagnosed UTIs • Assess certain attributes of ED patients diagnosed with UTIs through chart review
Provide Feedback • Caculate and illustrate monthly long term care UTI rates on an ongoing basis • Communicate how closely patients treated for UTIs at long term care facilities fit the protocol criteria • Report the attributes of ED patients diagnosed with a UTI • Document UTI testing in the ED
Data Collection Tools and Forms • For long term care: • Chart review form • An aide for applying the definition of a UTI in LTC • Chart review spreadsheet • Documentation of monthly chart reviews to be submitted each month • Measuring facility urinary tract and C difficile infection rates • Documentation of events and denominator data
Data Collection Tools and Forms • For Emergency Departments • Chart review form • Assists in determining the attributes of patients diagnosed with UTIs in the ED • Chart review spreadsheet • Submission of monthly chart review documentation • Measuring urine testing and ED visits
Chart Review Data Collection Form • Chart reviews will examine the characteristics of patients that are being treated for UTIs • Include patients >= 70 years of age • In long term care: • Include only patients with new onset, not recurrent, UTIs • In the Emergency Department: • Have a diagnosis code for urinary tract infection during the period under review and • Urine testing was initiated or done by an emergency department clinician.
Chart Review Data Collection Form for the Emergency Department
Notes about the chart review • Review 20 charts a month or five charts a week • Selecting charts to review: • If the name of the month starts with A-F review the first 20 patients with UTIs • If the name of the month starts with J-S review the last 20 patients with UTIs • Use the chart review form to guide your completion of the Excel spreadsheet but only the spreadsheet need to be submitted
Chart Review Spreadsheet • Document the answers to the questions on the chart review form and use them to complete the Data Submission Excel Spreadsheet • Answer Yes or No to each of the questions • After completing the chart reviews for each month email the spreadsheet to nora.mcelroy@state.ma.us
Completing the Chart Review Spreadsheet for the Emergency Department
Cases and Figures for Long Term Care • Track new onset Clostridium difficile and urinary tract infections monthly for patients >= 70 years of age in LTC • Determine number of urine cultures performed each month • Enter the monthly census, or resident days, for patients >=70 years of age • Submit monthly with the chart review spreadsheet
Calculating a Rate • The C difficile and UTI rates are calculated by: (UTIs/Resident-days)*10,000 • The spreadsheet will automatically calculate C difficile and UTI rates monthly
Summary • There are three tools to assist the collection of collaborative data • Chart Review Data Collection Form • Chart Review Spreadsheet • Cases and Figures Spreadsheet • Submit the Chart Review and Cases and Figures Spreadsheets monthly • Please forward any questions to Nora McElroy and nora.mcelroy@state.ma.us or (617) 983-6873
Thank you! • Any Questions? • Special thanks to all of the collaborators who provided valuable assistance and advice in the completion of the tools for this project.