Download
1 / 19
240 likes | 990 Views
Measurement and Measurement Scales. Measurement is the foundation of any scientific investigation Everything we do begins with the measurement of whatever it is we want to study Definition: measurement is the assignment of numbers to objects. Example:

E N D
Measurement and Measurement Scales • Measurement is the foundation of any scientific investigation • Everything we do begins with the measurement of whatever it is we want to study • Definition: measurement is the assignment of numbers to objects
Example: When we use a personality test such as the EPQ (Eysenck Personality Questionnaire) to obtain a measure of Extraversion – ‘how outgoing someone is’ we are measuring that personality characteristic by assigning a number (a score on the test) to an object (a person)
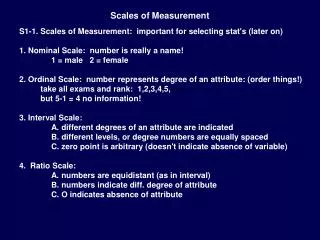
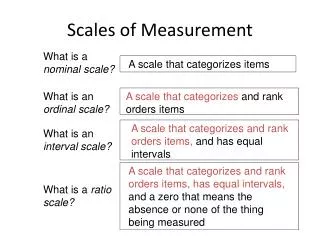
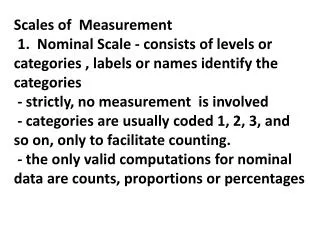
Four Types of Measurement Scales Nominal Ordinal Interval Ratio • The scales are distinguished on the relationships assumed to exist between objects having different scale values • The four scale types are ordered in that all later scales have all the properties of earlier scales—plus additional properties
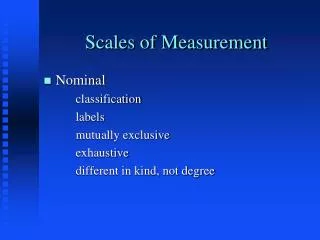
Nominal Scale • Not really a ‘scale’ because it does not scale objects along any dimension • It simply labels objects Gender is a nominal scale Male = 1 Female = 2
Religious Affiliation Catholic = 1 Protestant = 2 Jewish = 3 Muslim = 4 Other = 5 Categorical data are measured on nominal scales which merely assign labels to distinguish categories
What about symptoms of depression from a psychiatric assessment? None = 0 Mild = 1 Moderate = 2 Severe = 3
Ordinal Scale • Numbers are used to place objects in order • But, there is no information regarding the differences (intervals) between points on the scale
Interval Scale • An interval scale is a scale on which equalintervals between objects, represent equaldifferences • The interval differences are meaningful • But, we can’t defend ratio relationships
Fahrenheit Scale • Interval relationships are meaningful • A 10-degree difference has the same meaning anywhere along the scale • For example, the difference between 10 and 20 degrees is the same as between 80 and 90 degrees • But, we can’t say that 80 degrees is twice as hot as 40 degrees • There is no ‘true’ zero, only an ‘arbitrary’ zero
Ratio Scale • Have a true zero point • Ratios are meaningful • Physical scales of time, length and volume are ratio scales • We can say that 20 seconds is twice as long as 10 seconds
It isn’t so straight-forward?? • The underlying construct or variable being measured defines the scale of measurement, not the numbers themselves (Why?) • Statistical procedures use numbers without considering the underlying constructs that are measured • Measurement is the foundation, but whether or not statistics can be interpreted depends on research design issues
Variables and Constants • The names imply their meaning in statistics • Properties of objects that can take on different values are referred to as variables • A constant is a number that does not change its value (is constant) in a given situation
Discrete and Continuous Variables • Discrete variables have a relatively small set of possible values gender, marital status, religious affiliation • Continuous variables can (theoretically) assume any value between the lowest and highest points on the scale time, distance, weight
Independent and DependentVariables • Independent variables: manipulated by the experimenter under the control of the experimenter • Dependent variables: not under the experimenter’s control usually the outcome to be measured • Typically, we are interested in measuring the effects of independent variables on dependent variables
What are the independent and dependent variables? An experimenter measures blood pressure response in male and female hypertensive subjects, randomly assigned to two drug treatment conditions: standard medication A, and improved medication B
Statistical Notation • Variables will be represented by an uppercase letter (e.g., X, Y, or Z) • An individual value of that variable will be represented by the letter and a subscript (e.g., Xi or Zi)
Example: a set of aggression scores from 5 depressed adolescents 10 12 25 7 40 the set of scores is referred to as X X1=10 X2=12 X3=25 X4=7 X5=40 To refer to a single score, without specifying which one, we will use Xi, where i can take on any value from 1 to 5, or 1 to N.
Summation Notation One of the most common symbols in statistics is the uppercase Greek letter sigma () means sum up, or add up N Xi = 10 + 12 + 25 + 7 + 40 = 94 i N Xi X = i
2 X = 102 + 122 + 252 + 72 + 402 = 2518 Sum up the squared values of X 2 (X) = (94)2 = 8836 (sum the values of X) and then square the sum Always do what is in the parentheses first, before performing operations outside of parentheses