Download
1 / 53
530 likes | 532 Views
Learn how to analyze and interpret flow cytometry data using R and Bioconductor. Explore topics such as gating, compensation, transformation, and visualization.

E N D
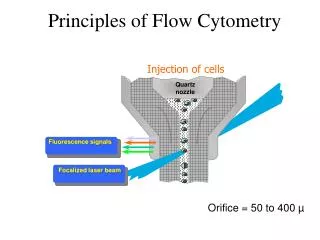
Making Sense out of Flow Cytometry Data Overload A crash course in R/Bioconductor and flow cytometry fingerprinting
Outline • Background • R • Bioconductor • Motivating examples • Starting R, entering commands • How to get help • R fundamentals • Sequences and Repeats • Characters and Numbers • Vectors and Matrices • Data Frames and Lists • Importing data from spreadsheets • flowCore • Loading flow cytometry (FCS) data • gating • compensation • transformation • visualization • flowFP • Binning • Fingerprinting • Comparing multivariate distributions • Writing your own functions • Installing and running R on your computer • Suggestions for further reading and reference
Background • R • Is an integrated suite of software facilities for data manipulation, simulation, calculation and graphical display. • It handles and analyzes data very effectively and it contains a suite of operators for calculations on arrays and matrices. • In addition, it has the graphical capabilities for very sophisticated graphs and data displays. • It is an elegant, object-oriented programming language. • Started by Robert Gentleman and Ross Ihaka (hence “R”) in 1995 • as a free, independent, open-source implementation of the S programming language (now part of Spotfire) • Currently, maintained by the R Core development team – an international group of hard-working volunteer developers http://www.r-project.org http://cran.r-project.org/doc/contrib/Owen-TheRGuide.pdf
Background • Bioconductor • “Is an open source and open development software project to provide tools for the analysis and comprehension of genomic data.” • Goals • To provide widespread access to a broad range of powerful statistical and graphical methods for the analysis of genomic data. • To provide a common software platform that enables the rapid development and deployment of extensible, scalable, and interoperable software. • To further scientific understanding by producing high-quality documentation and reproducible research. • To train researchers on computational and statistical methods for the analysis of genomic data. http://bioconductor.org/overview
A motivating example I’ve just collected data from a T cell stimulation experiment in a 96-well plate format. I need to gate the data on CD3/CD4. How consistent are the distributions, so that I can establish one set of gates for the whole plate?
Another motivating example I’m concerned that drawing gates to analyze my data introduces unintended bias. Additionally, since I have multiple data files, drawing multiple gates is time consuming. Can I use R to compute gates and then apply these same objective gating criteria to multiple data files?
Another motivating example Autogate lymphocytes and monocytes Automatically analyze FMO tubes
Back to the basics • R is a command-line driven program • the prompt is: > • you type a command (shown in blue), and R executes the command and gives the answer (shown in black)
Simple example: enter a set of measurements • use the function c()to combine terms together • Create a variable named mfi • Put the result of c()into mfi using the assignment operator <- (you can also use =) • The [1] indicates that the result is a vector
Help, functions, polymorphism • help (log) • ?log • apropos(“log”)
Characters and Numbers • Characters and character strings are enclosed in “” or ‘’ • Special numbers • NA – “Not Available” • Inf – “Infinity” • NaN – “Not aNumber”
Vectors and Matrices • The subset operator for vectors and matrices is [ ]
Vectors and Matrices • You can extend the length of a vector via subsetting … but not a matrix
Vectors and Matrices • However, all’s not lost if you want to extend either the columns … … or rows
Data Frames • A Data Frame is like a matrix, except that the data type in each column need not be the same • Often, a Data Frame is created from an Excel spreadsheet using the function read.table() Save As… a tab-delimited text file.
Handling Flow Cytometry Data: flowCore • flowCore is a base package that supports reading and manipulation of FCS data files • The fundamental object that encapsulates the data in an FCS file is a flowFrame • A container object that holds a collection of flowFrames is called a flowSet • In the next slides we will go over • reading an FCS file • gating • compensation • transformation • visualization
needs to be transformed because it is rendering the linear data in the FCS file
Lines require library(fields) • Percentages are in summary(fres)$p[1:4] • Percentages are drawn in the graph with text()
Roederer M, Moore W, Treister A, Hardy RR & Herzenberg LA. Probability binning comparison: a metric for quantitating multivariate distribution differences. Cytometry 45:47-55, 2001. and Rogers WT, Moser AR, Holyst HA, Bantly A, Mohler ER III, Scangas G, and Moore JS, Cytometric Fingerprinting: Quantitative Characterization of Multivariate Distributions, Cytometry 73A: 430-441, 2008. Fingerprinting Flow Cytometry Data: flowFP • flowFP • aims to transform flow cytometric data into a form amenable to algorithmic analysis tools • Acts as in intermediate step between acquisition of high-throughput FCM data and empirical modeling, machine learning and knowledge discovery • Implements ideas from
The basic idea • Subdivide multivariate space into bins • Call this a “model” of the space • For each flowFrame in a flowSet, count the number of events in each bin in the model • Flatten the collection of counts for a flowFrame into a 1D feature vector • Combine all of the feature vectors together into a n x m matrix • n = number of flowFrames (instances) • m = number of bins in the model (features) • Also, tag each event with its bin membership • facilitates visualization, interpretation • can be used for gating
Bin Number Probability Binning > plot (mod, fs)
Class Constructors • flowFPModel (base class) • Consumes a flowFrame or flowSet • Produces a model, which is a recipe for subdividing multivariate space • flowFP • Consumes a flowFrame or flowSet, and a flowFPModel • Produces a flowFP, which represents the multivariate probability density function as a fingerprint • Also tags each event with its bin membership • flowFPPlex • Consumes a collection of flowFPs • The flowFPPlex is a container object to facilitate handling large and complex collections of flowFPs
Writing Your Own Functions # # It’s a good idea to comment your code # myfunc <- function (arg1=10, arg2, ...) { # your code goes here answer <- log (arg1, base=arg2) return (answer) } comments declaration assignment code block return
Obtaining R and Bioconductor • R • http://cran.r-project.org/ • Bioconductor • http://bioconductor.org/GettingStarted