Download
1 / 18
340 likes | 1.27k Views
Basics of Flow Cytometry. Holden Maecker. Outline. Definitions, what can be measured by flow cytometry Fluidics: Sheath and sample streams, flow cells, sorting Optics: Lasers, filters Electronics: PMTs, signal processing Fluorochromes: spectra, spillover

E N D
Basics of Flow Cytometry Holden Maecker
Outline • Definitions, what can be measured by flow cytometry • Fluidics: Sheath and sample streams, flow cells, sorting • Optics: Lasers, filters • Electronics: PMTs, signal processing • Fluorochromes: spectra, spillover • Data analysis: FSC files, gating, statistics
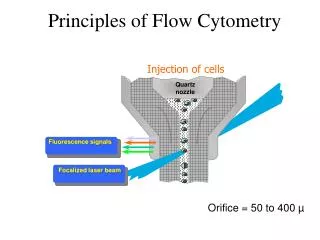
Definitions • Flow cytometry: study of cells as they move in fluid suspension, allowing multiple measurements to be made per cell. • FACS™: fluorescence-activated cell sorting
What measurements can be made? • Forward light scatter (FSC): proportional to cell size • Side light scatter (SSC): proportional to cell granularity • Fluorescence: • Binding of fluorescent-labeled antibodies • Ca++-sensitive dyes within cells • Fluorescent proteins expressed by cells • Binding of DNA dyes
largest and most granular population 1000 Granulocytes 800 600 400 Monocytes 200 smallest and least granular population Lymphocytes 0 0 200 400 600 800 1000 Scatter profile of lysed whole blood Side Scatter Forward Light Scatter
Fluorescence data display Negative control histogram PE Number of Events FITC Fluorescent Intensity FITC
Major components of a flow cytometer • Sample intake port • Sheath and waste reservoirs • Flow cell • Laser(s) • Optical filters • PMTs (photomultiplier tubes) or photodiodes • Signal processor
Cytometer fluidics create laminar flow Sample stream Flow Cell Sheath stream Laser beam Cell
Typical 2-color cytometer configuration FL1 PMT 488/10 nm band pass filter 530/30 nm band pass filter SSC PMT 1% ND front surface mirror FL2 PMT 560nm short pass dichroic mirror 585/42 nm band pass filter 488nm band pass filter 488nm laser beam FSC PD flow cell
Background and autofluorescence • All cells have a certain level of background fluorescence, due to: • Autofluroescence: from pigments and fluorescent moieties on cellular proteins • Non-specifically bound antibodies, and free antibody in the sample stream • The level of autofluorescence varies with the wavelength of excitation and collection: • Highest in FITC, PE detectors; lowest in far red (APC, Cy7) detectors
Fluorescence sensitivity • Detection Efficiency (Q): number of photoelectrons generated per molecule of fluorophore • Dependent upon fluorophore, filters, PMT sensitivity, voltage gain setting, etc. • Background (B): non-specific signal intrinsic to the system • Dependent upon autofluorescence, unbound fluorophore, stray light, etc.
Fluorescence spillover Emission of FITC in PE channel
1650 - 185 • 3540 - 125 Compensating for spillover compensated uncompensated FITC mean fluorescence PE mean fluorescence ---------------------------- ---------------------------- negative positive negative positive ----------- ---------- ----------- ---------- uncompensated 125 3540 185 1650 compensated 125 3560 135135 % Spillover = X 100
FCS files • FCS 2.0 and FCS 3.0 conventions • Often referred to as list-mode files • Contain all of the measurements (FSC-H, FSC-A, SSC-H, SSC-A, FL1-H…) for each individual cell processed in a given sample
Web reference tools • BD Spectrum Viewer: http://www.bdbiosciences.com/spectra • Maecker lab weblog: http://maeckerlab.typepad.com (protocols, manuscripts, literature updates)