Download
1 / 37
370 likes | 462 Views
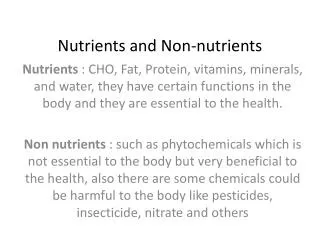
Basic Nutrients. Proteins Lipids Carbohydrates Energy Vitamins Minerals Antinutrients/toxins Attractants. Proteins. Most expensive feed component Utilization varies—animal vs plant protein Major source of nitrogen in effluents Must be balanced with energy. Protein Requirements.

E N D
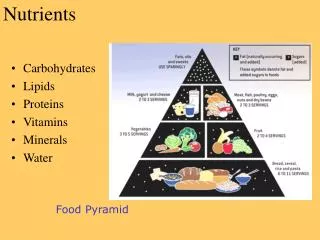
Basic Nutrients • Proteins • Lipids • Carbohydrates • Energy • Vitamins • Minerals • Antinutrients/toxins • Attractants
Proteins • Most expensive feed component • Utilization varies—animal vs plant protein • Major source of nitrogen in effluents • Must be balanced with energy
Protein Requirements • Important due to implications in feeding costs and effluents • Must be established with small rapidly growing fish • Requirements decrease with increasing size of fish
Protein Studies • Minimum requirement studies • Individual amino acid requirements • Feeding regimes--metabolic studies • Alternate protein sources--palatibility, attractability
Weight Gain-Protein Requirement ** 35 40 45 ** % Dietary Protein Serrano et al., 1992
Weight Gain--Metabolic Study Weight gain (g) 0 1.8 3.6 7.3 14.6 21.9 29.2 g digestible protein/kg bw/day McGoogan and Gatlin, 1998
Amino Acid Requirements • Must be met to ensure maximum weight gain and health • Deficiency symptoms—reduced weight gain, amino acid specific symptoms • Methionine and lysine usually most limiting • Studies involve feeding diets containing graded levels of test amino acid • Data usually fitted to regression analysis or broken line method to determine requirement
Lysine Requirement—Red Drum % initial wt
Methionine Requirement—Red Drum % initial wt
Lipids Efficient energy source Essential fatty acids Phospholipids, steroids, prostaglandins Deposition
Lipid Deposition • Excessive deposition--inefficient energy utilization • Physiological/health concerns—oxidation of membrane lipids • Final product quality
Lipid Studies • Inclusion level • Essential fatty acids • Alternate lipid sources
Lipids--Indicators • Weight gain • Intraperitoneal fat (IPF) ratio • Enzymatic/biological indices
Weight Gain--Lipid Requirement % initial wt. 1.7 4.0 11.2 15.0 18.8 7.4 % Dietary Lipid Williams and Robinson, 1988
Weight Gain--Lipid Study % initial wt. a ab ab b 0.5 7 14 21 % Dietary Lipid
IPF Ratio--Lipid Study IPF wt. x 100/body wt. a ab b c 0.5 7 14 21 % Dietary Lipid
Lipids--Essential Fatty Acids • Certain fatty acids necessary for normal growth and health--n-6 and n-3 • Important implications for human health • Marine lipids high in n-3 fatty acids,
Lipids--Essential Fatty Acids • Freshwater fish usually require linoleic (18:3n-3)--chain elongation:channel catfish • Marine fish usually require EPA and DHA--no chain elongation • Other fish--tilapia require n-6, eels, chum salmon, carp require mixture n-3 and n-6
Dietary Lipid Sources Characteristic Source Menhaden oil High HUFA Corn oil High 18:2n-6 Coconut oil High 12:0,14:0 Beef tallow High 16:0, 18:0 Soy oil High 18:1 Tricparylin High 8:0
Weight Gain--Alternate Lipid Sources % initial wt. a b b c c Menhaden Coconut Corn MCT2 MCT1 Dietary Lipid
Weight Gain-Sea Grant % initial wt. Men Coco Soy Tallow Lec 14% Men Coco2 Dietary Lipid
MDA levels--Lipid Study nmoles/ g liver a ab b b 0.5 7 14 21 % Dietary Lipid
Carbohydrates • Inexpensive energy source • Variable utilization--species dependent • Binding agents-extrusion
Weight Gain of Hybrid Striped BassCHO/Lipid Study % initial wt. 25/10 31/7.5 36/5 42/2.5 Nematipour et al., 1992 CHO/Lipid Ratio
IPF Ratio of Hybrid Striped BassCHO/Lipid Study IPF wt. x 100/body wt. a ab bc c 25/10 31/7.5 36/5 42/2.5 Nematipour et al., 1992 CHO/Lipid Ratio
Energy • Growth • Maintenance • Reproduction
Energy Units • Joules (J)- the metric measure of energy, the energy expended in accelerating 1 gram by 1 cm/s • calorie (cal) - the traditional measure or energy, the amount of energy to raise the temperature of 1 gram of water from 16.5°to 17.5° C; 1000 calories=1 kcal • 1 cal=4.184 Joules
Partitioning of Dietary Energy Intake energy Excretory loss fibrous materials Digestible Energy Gill/urine excretion Metabolizable Energy Heat increment Digestion/absorption Waste formation Net Energy Maintenance Activity Recovered Energy Growth, Fat deposition, Reproduction
Energy Advantages of Fish • Heat increment lower than birds and mammals--excrete ammonia vs urea/uric acid • Maintenance energy lower—do not regulate body temperature • Gravity—smaller portion of energy spent for voluntary or resting activity
Energy:Protein Ratios • Proper balance for maximum weight gain • Low E:P ratio--reduced weight gain • High E:P ratio--increased lipid deposition; reduced feed consumption
Weight Gain of Hybrid Striped BassEnergy/Protein Ratio Study % initial wt. a ab ab bc cd d 6 7 8 9 10 11 Energy/Protein Ratio Nematipour et al., 1992 (kcal/g protein)
IPF Ratio of Hybrid Striped BassEnergy/Protein Ratio Study IPF wt. x 100/body wt. a ab b c c c 6 7 8 9 10 11 Energy/Protein Ratio Nematipour et al., 1992 (kcal/g protein)
Feeding Assessment Feed Efficiency Ratio (FER) = wt gain/ wt feed offered x 100 higher numbers better efficiency Feed Conversion Ratio (FCR) = wt feed offered/wt gain lower numbers better efficiency
Feeding Assessment • Typical “good” FCR’s for fish range from 1.5 to 1.8 (FER = 66 to 55%) • Poultry also good converters, FCR’s of 2 (FER= 50%) • Pigs and cattle higher, FCR’s ranging from 6-10 (16 to 10%)
Finishing/Specialty Feeds • Another area of little research • Could prove important for enhancing final product quality • Seasonal feeds to maximize weight gain under different environmental conditions • Marketing--high levels of n-3??
Median Lethal Temperatures o C a b b bc c Coconut Sat Men Corn Men 14 Men Dietary Lipid
n-3 HUFA Levels-Cold Tolerance g/100g Coconut Sat Men Corn Men 14 Men Dietary Lipid