Download
1 / 18
180 likes | 387 Views
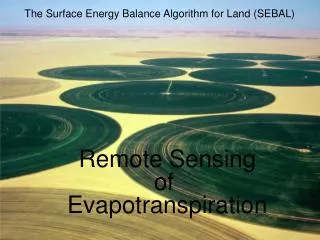
Globally distributed evapotranspiration using remote sensing and CEOP data. Eric Wood, Matthew McCabe and Hongbo Su Princeton University. Introduction. Evapotranspiration (ET) provides the link between the energy and water budgets at the land surface.

E N D
Globally distributed evapotranspiration using remote sensing and CEOP data Eric Wood, Matthew McCabe and Hongbo SuPrinceton University
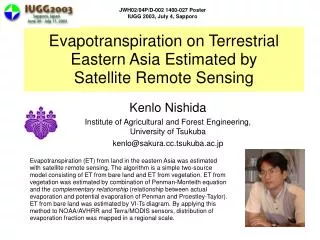
Introduction Evapotranspiration (ET) provides the link between the energy and water budgets at the land surface. Developing a globally robust algorithm for the prediction of surface energy fluxes is a significant challenge The purpose of this analysis is to evaluate the adaptability of varied techniques to different climatic conditions and land cover classifications Also, what is the potential for using operational products in achieving routine prediction of evapotranspiration
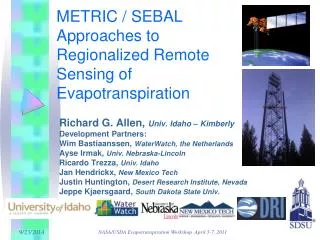
MOD-16 Evapotranspiration Product • Princeton University funded to research a MODIS based ET product (July, 2004) • Based primarily on the SEBS model, although other approaches are being explored – (can one model work in all environments/all conditions) • Global product – but locally validated – hence need for thorough evaluation – CEOP sites!!! • Princeton is keen to partner with other groups to investigate the best means of forwarding the planned MODIS product – model intercomparison, field experiments etc… 1 Su, B. (2002). The surface energy balance system (SEBS) for the estimation of turbulent heat fluxes. Hydrol. Earth Sys. Sci. 6(1): 85-99
Modeling Evapotranspiration • Use the Surface Energy Balance Model (SEBS)1 to determine daily/pentad/monthly ET predictions. • Combining available land surface information, meteorological, surface temperature, vegetation, radiation data • Make use of available MODIS products – supplement with other sources of data (LIS) • Undertake comparisons with other approaches over varied environments…
Rn = (1- α) SW + ε LW - εσ SEBS Model Description Rn – G = H + LE Components of the radiation balance are used to determine the net radiation (Rn) – SW , α, ε, Ts, LW The ground heat flux (G) is parameterized as a function of fractional cover1 – LAI/NDVI relationships 1 Kustas, W. P. and C. S. T. Daughtry (1990). Estimation of the soil heat flux/net radiation ratio from spectral data. Agric. For. Meteorol. 49: 205-223
Wind, air temperature, humidity (aerodynamic roughness, thermal dynamic roughness) SEBS Model Description SEBS calculates H using similarity theory: Various sub-modules for calculating needed components…
SEBS Model Description • CEOP observations used to assess estimates of evapotranspiration determined using different approaches. • Forcing data from validation tower sites supplemented with MODIS data to produce estimates of surface fluxes.
Evaluating SEBS Model Results Predictions are only as good as the evaluation data!!! • Issues of measurement accuracy, frequency, type… • Intensive field experiments offer excellent detail, but are temporally limited • Continuous measurements are usually spatially sparse… • What is the best/most efficient combination of these. Global product – but locally validated
Global Evaluation - CEOP Data • Coordinated Enhanced Observation Period provides globally distributed data sets from which estimates of ET can be produced. Located over a variety of landscapes and hydro-climatologies they offer: • Data to assess global scale application • Allow comparison of different model output • SEBS, modified Priestley-Taylor, modified Penman-Monteith# and GLDAS model output #Boegh, E. et al. (2002). Evaluating evapotranspiration rates and surface conditions using Landsat TM to estimate atmospheric and surface resistance. Remote Sensing of Environment, 79(2-3): 329-343.
ET Predictions with CEOP Data Time series of GLDAS ~ 0.25º 3-hrly time step 4 sites at global locations: Netherlands, Germany, USA, Brazil
SEBS with Operational Data • Run SEBS with: • CEOP data + MODIS • GLDAS + MODIS • GLDAS model output • for the EOP-1 • Results are limited by lack of coincident sensor/observation data
SEBS with Operational Data Mean values approximate reasonably well (within 20%), but instantaneous data are somewhat variable Bondville (corn) indicates particular difficulty – issues of representative flux measurement, site characteristics, capturing vegetation dynamics with RS data Berms – considering it is forested – illustrates pleasing results
Scale Issues in ET Modeling How does our ability to predict ET relate to the scale of the observations?? What is the role of surface heterogeneity? How do different model forcings scale – surface temp, vegetation, meteorology? Is there a relationship with other hydrological variables – or do the time scales of the process reduce their influence? How do you get information betweensatellite overpasses
Summary and Conclusions Correct estimation of radiation components is critical Evaluation data Scale of measurements ….
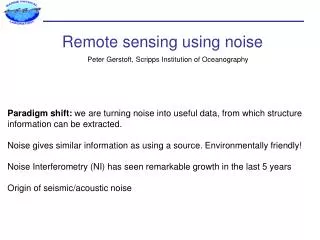
Hydrological Measurement from Space Rainfall • Rainfall • Runoff • Soil Moisture • Evapotranspiration • Surface Temperature • Vegetation Information Water level - altimetry Surface temperature Vegetation - LAI
Presentation Overview 1. Background 2. Overview and Evaluation of SEBS 3. CEOP Analyis 4. Summary