Download
1 / 2

E N D
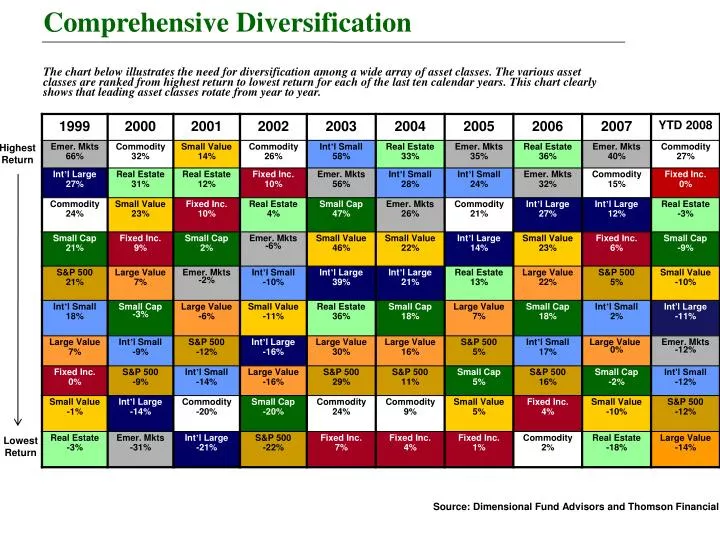
Comprehensive Diversification The chart below illustrates the need for diversification among a wide array of asset classes. The various asset classes are ranked from highest return to lowest return for each of the last ten calendar years. This chart clearly shows that leading asset classes rotate from year to year. Highest Return Lowest Return Source: Dimensional Fund Advisors and Thomson Financial
Comprehensive Diversification Periodic Table: The individual asset classes are represented by corresponding indices as follows: Lg. Value – Russell 1000 Value Index, Small Cap – Russell 2000 Index, Small Value – Russell 2000 Value Index, Commodity – Dow Jones AIG Total Return Commodity Index, Real Estate – Dow Jones Wilshire REIT (Full Cap) Index, Int’l Large – MSCI EAFE Index (Gross Dividends), Int’l Small – MSCI EAFE Small Cap (Price Only) Index, Emer. Mkts – MSCI EM Free Index, and Fixed Income – Lehman Brothers Credit Bond Index Intermediate. (updated 7/08) • Past performance does not guarantee future results