Download
1 / 40
410 likes | 534 Views
Adding time diversification to risk diversification. Presented by Michel M. Dacorogna Moscow, Russia, April 23-24,2008. Important disclaimer.

E N D
Adding time diversificationto risk diversification Presented by Michel M. Dacorogna Moscow, Russia, April 23-24,2008
Important disclaimer Although all reasonable care has been taken to ensure the facts stated herein are accurate and that the opinions contained herein are fair and reasonable, this document is selective in nature and is intended to provide an introduction to, and overview of, the business of Converium. Where any information and statistics are quoted from any external source, such information or statistics should not be interpreted as having been adopted or endorsed by Converium as being accurate. Neither Converium nor any of its directors, officers, employees and advisors nor any other person shall have any liability whatsoever for loss howsoever arising, directly or indirectly, from any use of this presentation. The content of this document should not be seen in isolation but should be read and understood in the context of any other material or explanations given in conjunction with the subject matter. This document contains forward-looking statements as defined in the US Private Securities Litigation Reform Act of 1995. It contains forward-looking statements and information relating to the Company's financial condition, results of operations, business, strategy and plans, based on currently available information. These statements are often, but not always, made through the use of words or phrases such as 'expects', 'should continue', 'believes', 'anticipates', 'estimated' and 'intends'. The specific forward-looking statements cover, among other matters, the reinsurance market, the outcome of insurance regulatory reviews, the Company's operating results, the rating environment and the prospect for improving results, the amount of capital required and impact of our capital improvement measures and our reserve position. Such statements are inherently subject to certain risks and uncertainties. Actual future results and trends could differ materially from those set forth in such statements due to various factors. Such factors include general economic conditions, including in particular economic conditions; the frequency, severity and development of insured loss events arising out of catastrophes; as well as man-made disasters; the outcome of our regular quarterly reserve reviews, our ability to raise capital and the success of our capital improvement measures, the ability to exclude and to reinsure the risk of loss from terrorism; fluctuations in interest rates; returns on and fluctuations in the value of fixed income investments, equity investments and properties; fluctuations in foreign currency exchange rates; rating agency actions; the effect on us and the insurance industry as a result of the investigations being carried out by US and international regulatory authorities including the US Securities and Exchange Commission and New York’s Attorney General; changes in laws and regulations and general competitive factors, and other risks and uncertainties, including those detailed in the Company's filings with the US Securities and Exchange Commission and the SWX Swiss Exchange. The Company does not assume any obligation to update any forward-looking statements, whether as a result of new information, future events or otherwise. Please further note that the Company has made it a policy not to provide any quarterly or annual earnings guidance and it will not update any past outlook for full year earnings. It will however provide investors with perspective on its value drivers, its strategic initiatives and those factors critical to understanding its business and operating environment. This document does not constitute, or form a part of, an offer, or solicitation of an offer, or invitation to subscribe for or purchase any securities of the Company. Any securities to be offered as part of a capital raising will not be registered under the US securities laws and may not be offered or sold in the United States absent registration or an applicable exemption from the registration requirements of the US securities laws.
Changing Risk Landscape • Peak risks are growing due to: • Demographic changes: concentration of population in hazardous areas, movements of populations favors the spread of diseases (AIDS, SARS, …) • Social & political changes: better leaving standards, more demanding people (e.g. liability), changing of legal systems, terrorism, political instabilities in oil rich regions, … • New technologiescould bring along new risks: nanotechnology, cellular phones, new drugs (VIOXX) … • New financial products(especially in life insurance and credit) • More demanding & more attentive stakeholders: policyholders concerned with financial stability, regulators revisit insurances, better informed investors (Return on Equity ROE).
New Risks are Multiplying with Varying Severity and Likelihood Infectious disease, developing world NatCat: NatCat: The 26 Core Global Risks: Likelihood with Severity by Economic Loss More than 1 trillion Retrenchment from globalization (developed) Asset price collapse Slowing Chinese economy (6%) 250 billion –trillion Oil and gas price spike Pandemic CII breakdown Transnational crime and corruption Chronic disease, developed world Middle East instability Cyclone Heatwaves & droughts Liability regimes Earthquake Major fall in US$ 50-250 billion Severity (in US$) Interstate & civil wars Retrenchment from globalization (emerging) Fiscal crisis in advanced economies Food insecurity Extreme climate change related weather NatCat: Extreme inland flooding Failed & failing states Emergence of nanotechnology risks International terrorism 10-50 billion Loss of freshwater Collapse of NPT 2-10 billion below 1% 1-5% 5-10% 10-20% above 20% Likelihood
Urban population concentratesin riskiest areas Source : Sherbinin, Shiller & Pulsipher (2007)
Number of Terrorist Attacks is Rising Dramatically 5000 4000 3000 2000 1000 0 1968 1970 1972 1974 1976 1978 1980 1982 1984 1986 1988 1990 1992 1994 1996 1998 2000 2002 2004 2006 Number of international (since 1968) and domestic (since 1998) incidents INCIDENTS Source: MIPT terrorism knowledge base
Issues in Risk Management • Society is asking more and more financial markets and insurances to be the main providers of risk mitigating solutions as far as the financial impact of risk is concerned. • However, the finance service industry and particularly insurers are faced with two major issuesin risk management: • New regulation: Basel II (banks) and Solvency II (European insurers) • New accounting rules: IFRS • Academic research should help the industry facing them by providing better tools and models.
Challenge for theFinancial Service Industry • Both questions challenge the industry and the academic worldin terms of the methods used to model for instance operational risk or in the insurance industry to account for the reserves. • Often the rules applied to insurers are derived from those applied to banks because the latter have already been in place for a few years and have been quite successful. • After all they are both risk bearers. Aren’t they?
Banks and Insurers as Risk Bearers • Banks have traditionally been taking credit riskson their books in their wholesale lending operations, but also market risksthrough their securities trading operations. • Insurers and reinsurers have been taking most other kinds of risks: mortality and interest rate risks for life insurers, natural disasters, liability and accident risks for non-life insurers. • The traditional providers of risk management solutions are investment banks and reinsurers. • Recently, banks by securitizing most of their credit risks are moving away from their traditional risk bearing function.
Banks and Insurances as Risk Bearers (continued) • For banks the risk assumption on the balance sheet is only a small part of their activity; the main activities are intermediation and other services. • The investment bank is a sort of broker (financial intermediary) to access the financial markets. It is taking little risk except when trading securities for its own account. • The reinsurer on the other hand provides its own capital and balance sheet to carry the risk. It is a sort of risk warehouseand risk appears on both sides (asset and liability) of its balance sheet. • That is why capital-to-asset ratiois substantially higher for non- life insurers, somewhat smaller for life insurers, but still higher than for banks.
Regulators and Accountants • Regulators want insurers to develop internal modelsfor risk- based capital (RBC) (first and second pillar of Solvency II). • Accountant standard setters want insurers to mark-to-market their assets (IAS 39) and eventually their liabilities. • Most of those rules are inspired by the bank regulations and accounting. • The purpose is to protect the policyholders (regulators) and to bring more transparencyin the value creation of the industry (accountants). • Is the industry ready for these challenges?
Challenges and Questions Ahead • First of all, the insurance industry needs still to adopt a common languageand disseminate best practices to build models. • Are we able to model the complexity of the business and the risks to a good level of accuracy? Do we have the methods and data in place? • Is the requirement for transparency (Pillar III of Solvency II and IFRS) going too far and introducing artificial volatility? • Is the principle of conservatism in accounting still followed: “anticipate no profit but anticipate all losses”, when using probabilities or NPVs in balance sheets?
More Questions and Challenges • Are we insuring verifiabilityand limiting the amount of discretion that managers may exert in deciding what the “right” numbers are: marking-to-market the liabilities might open Pandora’s box , because there is no financial market for insurance liabilities? • Despite their obvious similarities, have we really considered the major differencesbetween banking and insurance? • In insurance reserving is crucial and very difficult. Insufficient reserves account for two third of insurance insolvencies.
The Example of CAT Reserving • Reserving for natural catastrophes (CAT Reserving) is a good example of the problems that face the insurance industry in applying the new accounting rules • US-GAAP and the new IFRS rules do not allow to carry over reserves for future business. If no loss has occurred during the year then the reserves must be released: equalization reserves are not allowed anymore • Two main arguments speak for the introduction of those rules: • It is in the interest of shareholders to diminish the amount of free cash flows at the disposal of managers for fear of misuse. • Moreover, the tax authorities want to avoid artificial reserve increases that diminish tax payment.
Premiums and Claims • We have seen that insurance premiums are computed on the basis of the expected loss: • Premium = Expected Loss + Cost of Capital + Expenses • It is in the nature of CAT business that most of the time the claims will be much belowexpectation • Once in a while though, a catastrophe will occur with claims much aboveexpectationand the yearly premiums would not suffice to cover the liabilities • To survive such situations, insurance companies have learned to diversify their risks
Mitigating Catastrophic Risks • Diversification is usually thought in terms of geography and of type of risks. • For instance a reinsurance company would reinsure European windstorm and Japanese earthquakes as well as American hurricanes. • Given this type of risk, geographical diversification will not sufficeto avoid large fluctuations in the results, as we have seen recently. • Uncertainty in the results is penalized by investors. They will require higher reward for their investments. • This will, in turn, increase the costof insurance policies.
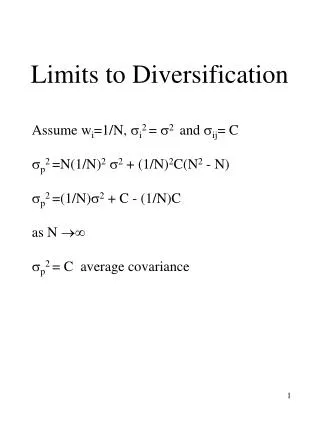
Time Diversification Helps • Traditionally, insurers have built equalization reservesto dampen the effectsof natural catastrophes on their balance sheet. • This is nothing else than diversifying the risk over time. • Some countries particularly exposed to catastrophic risks like Japan even require their insurance companies to hold equalization reserves. • The idea is simple: the years without natural disaster are used to build up reserves for the years where such a catastrophe occurs. • Since the probability of occurrence is low, it is possible on average to build substantial reserves before large claims happen.
Capital or Reserves, That is the Question ! • The argument against equalization reserves is that capital is here to be used when the premiums do not cover the claims. • If not actively invested, analysts would argue that capital should be given back to shareholders and again raised only when it is needed. • Unfortunately, if an insurance company tries to tap the market when it is known to have several hundred million dollars of claims to pay, it finds: • That there is less cash availablefrom the market; and • That the cash that can be found is much more expensivethan keeping it on the balance sheet.
Time Diversification is also Goodfor Long-Term Investors • Clearly, it is to the benefit of the policyholdersto keep an extra cushion. • Is it also true for shareholders? • For short-term investors: the chances of getting high returns is bigger, if reserves are released at the end of the year. • For long-term investors: the volatility incurred by an insurer that releases its CAT reserves every year is high, thus the Sharpe Ratioof the investment will be lower. • The extra-cash kept in the reserves differs from the capital: • it is not rewardedat the cost of capital and • no new riskis written against it.
An Illustrative Example • In a simple example we illustrate the view of a long-term investor: • We consider two companiesthat write only CAT risk against an initial capital of 100,000 USD. • One company follows US-GAAP and the other one is allowed to keep equalization reserves (time diversification). • We compute the yearly return on equity (ROE), Ri, which an investor would make by investing in such companies (all profits are paid as dividends) over a long period(10 to 30 years). • We also compute the Sharpe Ratio, S, for both investments assuming a risk free rate (R0) of 3% and computing:
Business Cycles and Cost of Capital • We introduce business cyclesby assuming softening of the market if the previous loss ratio is below 60%. The price is then reduced by 20% for the next year. • The hardeningof the market is modeled by a price increase of 200% if the previous loss ratio has reached 150%. • The cost of raising new capitalis put at 5% of the sum raised, which corresponds to the usual investment bank fees. We neglect other costs due to distress. • The company is allowed to keep equalization reserves up to an amount equivalent to the expected loss minus the paid losses. The cumulated reserves are not allowed to exceed the VaR(1%), i.e. 100,000 USD.
Performance Comparison in aSimple Deterministic Model In all cases, the time diversification company presents better Sharpe Ratios and most of the time better ROEs over 10 years (large loss 7th year).
The Stochastic Models • We model the risk with a lognormal distribution: • The parameters are chosen so that the Value-at-Risk (VaR) at the 1% level always equals100,000 USD, assuming that this is the risk-based capital (RBC). • We vary the coefficient of variationallowing for various tails to the distribution but keeping the same VaR. • The premium is computed according to the technical price: Expected Loss + 15% of the RBC + Expenses • Expenses are taken to be 5% of the expected loss.
The Stochastic Model (Fréchet Distribution) • We use also a fat-tailed distribution, the Fréchet distribution: • We compute the expectation: • And the expected shortfall: • Where G(a,z) is the incomplete gamma function:
Lognormal distribution For all parameters the VaR at 99% is 100’000 Fréchet distribution For all parameters the VaR at 99% is 100’000 Influence of the Parameters of the Distributionon the Expected Shortfall
Buildup of the Reserves Over Time We use 10,000 simulations over 30 years
Buildup of the Reserves Over Time (II) The CAT reserves’ buildup behavior is complex and depends on the fatness of the tails of the distribution (limit 100,000 USD).
Simulation Results • We simulate 10,000 times a period of 30 yearsand look at the results for two corporate finance metric the Sharpe ratio of the shareholder investment and the call option based on Merton’s model. • We see that the company can on average build up sufficientequalization reservesif the tails are sufficiently fat. • The fatter the tails the faster the equalization reserves buildup for both stochastic processes. • We see that with both investment metrics the US-GAAP company is valued lower than the company allowed to keep reserves over time.
Comparison of Sharpe Ratios • In general, the Sharpe ratio for time diversified companies is better than for US-GAAP companies. • The percentages are influenced by what happens at the beginning of the experiment. If the company is bankrupted after one or two years the US-GAAP company is better off.
The Merton Model Appliedto CAT Reserving • The Merton model views the share as a call option on the assets of a company. • In this case, we value the call options using the NPV of the cash flows over 30 years of both the time diversified company and the US-GAAP company. • We discount the cash flows with a risk free rate at 3%. • The result is that the option for the time diversified company has a higher value than the one of the US-GAAP company, in line with our Sharpe ratio results.
Costs and Benefits of Setting up Cat Reserves • The economics literature discusses two types of cost that could play a role in the determination of the optimal amount of cat reserves: • “Agency Costs of Free Cash Flows” (Jensen, AER, 1986) Instead of paying out free cash flows to shareholders, managers might use “free money” to engage to investment activities that (unverifiably) are not in the best interest of shareholders (e. g. negative NPV “empire building”, unduly diversify operations). • “Costs of Financial Distress” (e. g. Warner, JoF, 1977) Companies in distress face constraints on operating and investment decisions (imposed by regulators, creditors, nervous shareholders) that may prevent even good investment decisions.
Tradeoffs between Agency & Distress Costs in Cat Insurance • Higher cat reserves potentially accentuate the agency problem of free cash flows: • More cat reserves increase the amount of “free money” available for empire building. • Higher cat reserves potentially mitigate the financial distress costs: • More cat reserves diminish the likelihood of the firm running into a distress situation. An Open Question: How does the new cat risk modeling technology affect the optimal amount of cat reserves that insurers should set? The answer…
Consequence of CAT Modeling • The new catastrophe modeling technology has been standardizedand made the measurement of catastrophic risk exposuremoretransparent : • This diminishes the potential for the abusive setting or using of catastrophe reserves (for empire building, for engaging in or hiding negative NPV projects, for tax evasion etc). The existence of standard cat modeling toolsand the application of financial valuationover the long-term reinforce the argument for allowing cat reserves – even from a shareholder’s view
Conclusion • It is dangerous to simply apply rules designed for banks on insurance risks. • To mitigate risks insurers need all the diversification they can get includingtime diversification. • New technologyallows for more transparency without abandoning some old prudent habits (equalization reserves). • The integration of risk management, however, will demand more and more solutions that should imply a strong cooperationbetween insurances, banks and academics. • The lack of capacityrequires also that financial marketsbear some of the risks instead of the reinsurers.
Outlook • There are three important axis of development for research in risk management: • Develop the stochastic models to truly multi-period modelswhere time plays a key role. • Apply financial valuation methods to risks: this will accelerate the transfer of risks to financial markets and thus open up new investment opportunities. • Fully integrate the concepts of fat-tails and non-linear dependencein the pricing of risks. • Progress in this field can only help us coping with the growing risks and offer further economically sound risk management solutions.
Looking for New Risk Transfer Avenues Capital Market Risks Insurance Risks (Re)Insurance Balance sheets Capital Markets • “Securitization”: • Insurance-linked securities (CatEPut, Surplus Notes) • Securitization, CAT bonds, longevity bonds, etc. Insurance / Reinsurance Investment / Hedging