Download
1 / 18
180 likes | 282 Views
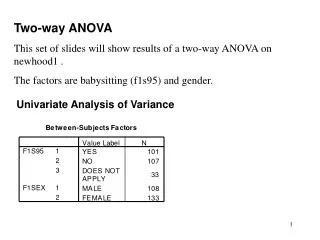
2 nd Year Practicals: Statistical Analysis Using E-Merge, E-Data Aid and EZ-ANOVA. Dr. Jonathan Stirk. Repeated Measure Design- (Fully-Within Subjects). Research Hypothesis : Does coping strategy influence pain? Dependent Variable : Report of pain level 0..50 (0=no pain, 50=excruciating).

E N D
2nd Year Practicals: Statistical Analysis Using E-Merge, E-Data Aid and EZ-ANOVA Dr. Jonathan Stirk
Repeated Measure Design-(Fully-Within Subjects) • Research Hypothesis: Does coping strategy influence pain? • Dependent Variable: Report of pain level 0..50 (0=no pain, 50=excruciating). • Independent Variables: • Coping strategy: Concentrate on Pain vs. Avoidance. • Time hand has been in ice water (3 levels: 30, 60, 90 sec). • 8 subjects participate in all conditions (“repeated measures 2 x 3 design”)
Individual data Note: some individuals always report pain, others are very resistant. Repeated measure design reduces subject variability. Time levels
ANOVA Source SS df MS F P Coping 46 1 46.02 1.87 0.213 related Error 172 7 24.54 Time 2140 2 1070.02 36.69 0.001 related Error 408 14 29.16 Coping*Time 288 2 144.02 21.09 0.001 related Error 96 14 6.83 Subjects 1055 7 150.74 • No main effect of coping strategy. • Main effect of time: more time = more pain. • Interaction: Avoidance better for short periods, but worse with longer intervals.
Your data • For each individual, enter their mean score for each condition/cell into your analysis. • Analyse target present and target absent data separately. (only use 2-WAY ANOVA). • Use E-Merge, E-Data Aid & EZ-ANOVA / SPSS. • If each factor has only 2-levels, no need for pairwise comparisons. • Interaction is probably important.
Example data Repeat for Target Absent data (stat 5,6,7,8 data)
Merging separate data files • Each subject run will create a single *.edat data file • E.g. ‘interlv-1-1.edat’, ‘interlv-2-1.edat’ etc. • Merge these into 1 large file using E-Merge • This produces a merge file (*.emrg) • You should open this merge file using E-Data Aid
E-Merge Select Unmerged files (check they are all from the same experiment) Click MERGE and name the merged file with something sensible Ctrl-Left click will also choose each file
E-Data Aid Open E-data aid and open the merged file You want to run separate analyses on the target present and target absent data, so choose filter (then checklist) and choose stat 1-4 or 5-8 (or whatever stat values are relevant for your exp’t if you have renumbered your cell conditions)
Filtering Data Once the filter is set your analysis will be limited to the Target Present or Absent subgroups You may also want to analyse only RTimes from “correct” trials so filter using ‘STIMULUS.ACC’=1 and look at % errors too
Analyse Data • To get the means for your data use the ANALYZE option in E-Data Aid (Looks like a calculator) • This will open the window seen on the right • Row- Subject • Column- Stat • Data- Stimulus.RT
E-Data ready for export / copy This analysis provides the MEANS for the 4 conditions you selected This can now be exported or copied to the clipboard ready to be analysed using EZ-ANOVA (or SPSS if you know how) Just select the data and press Ctrl-C to copy You may want to analyse median scores rather than means – double click on the data summary in previous window to alter
EZ-ANOVA Name your 2 factors (IV’s) e.g. Familiarity & Set Size (use max of 8 characters for factor & level names) Set levels, choose number of rows (subjects) Make sure you choose repeated measures design if it was
Results ANOVA Table
EZ-ANOVA Plot RT (msec) Set Size
ANOVA help • For additional help on related (within-subjects) ANOVA see • Keppel, G., Saufley, W.H.,Tokunaga, H. (1992) Introduction to Design and Analysis. (in library) • Sprinthall, R.C.(2003). Basic Statistical Analysis, 7th Edition. • Howell, D. (1992). Statistical methods for psychology. • Dancey, C.P & Reidy, J. (2002). Statistics without maths for psychology. • Or any other major stats text