Download
1 / 11
130 likes | 1.23k Views
Two-way ANOVA This set of slides will show results of a two-way ANOVA on newhood1 . The factors are babysitting (f1s95) and gender. Univariate Analysis of Variance. Two-way ANOVA The first table of results shows cell and marginal means. Two-way ANOVA

E N D
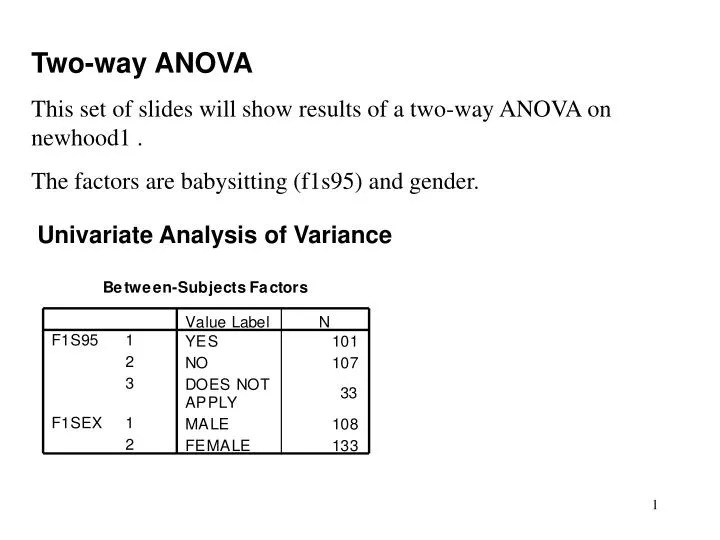
Two-way ANOVA This set of slides will show results of a two-way ANOVA on newhood1 . The factors are babysitting (f1s95) and gender. Univariate Analysis of Variance
Two-way ANOVA The first table of results shows cell and marginal means.
Two-way ANOVA Next comes Levene's test. It shows that we can assume the variances are equal in the population.
Two-way ANOVA Next we see the two-way ANOVA table. It has more lines than the source table we saw in class but does include lines for the two factors plus interaction:
Two-way ANOVA The tests of interest are on the lines labeled f1s95, f1sex, and f1s95*f1sex (the interaction). Only the f1s95 main effect (the babysitting effect) is significant (see arrow below):
Two-way ANOVA If we ask for estimated marginal means we get the means we saw above again, but also confidence intervals for marginals and cell means. Here I just show the cell means: Estimated Marginal Means
Two-way ANOVA The residual plots show that the variances seem equal across the 6 groups:
Two-way ANOVA Next we get the means plots. These show the interaction (or lack of one) plus each of the main effects. In this plot the lines represent the two gender groups. Both lines start high for the babysitters, then go down for the students who answered “no”) and then back up for the students who answered “does not apply”. Profile Plots
Two-way ANOVA This plot shows the gender effect. It is pretty boring and often looks like this for a two-level factor, regardless of whether the main effect is significant. This happens because the scale of Y is stretched to fit the full graph.
Two-way ANOVA This plot shows the babysitting effect. Here we can see how the main effect that was also evident in the cell means plot looks when we combine across the two gender groups.
Two-way ANOVA This last plot also shows the babysitting effect. It is the error bar plot. Here we can see The estimates of variability because we are plotting the 95% confidence interval for each group mean. We get this plot from the graphs menu, not the ANOVA menu.