Download
1 / 51
510 likes | 708 Views
Day Four: Introduction to Statistical Analysis. What are Statistics?. Procedures for describing, analyzing, and interpreting quantitative data Your choice of statistical technique should be guided by your research design and the type of data you have collected. Reminders:

E N D
What are Statistics? Procedures for describing, analyzing, and interpreting quantitative data Your choice of statistical technique should be guided by your research design and the type of data you have collected
Reminders: A variable is simply a phenomenon that is subject to variation or change An independent variable is a presumed effect or predictor variable A dependent variable is an outcome variable Data is simply a collection of measurements or observations in a study
Displaying Data • Frequency distributions • Characteristics of distributions: • Normal distributions • Skewness • Kurtosis
Used to describe or summarize sets of data to make them more interpretable or understandable Measures of central tendency mean, median, mode Measures of variability range, variance, standard deviation
Central Tendency What is the typical salary in SG? Mean - the arithmetic average Median - the middle score after ranking in order Mode - the most commonly occurring score
Measures of Variability Range - the difference between the highest and lowest score in a set of data Variance - the average squared distance between every score and the mean Standard deviation - the average distance between every score and the mean
Indices of Relative Standing • Rank scores • Percentiles • Standard Scores • Variations on Standard Scores
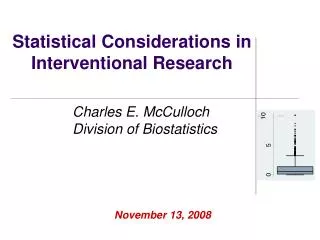
How likely is it that the effects I have seen in my study are true in the full population from which my sample is drawn? Using probability to make decisions about persuasiveness of study results
Statistics and Probability Probability simply represents a judgment about likelihood of outcomes, i.e., how likely is it that I could obtain a result like this purely by chance? Statistical inferences significant – very unlikely the effect would occur by chance, e.g. less than 5% not significant - results are likely to have occurred by chance
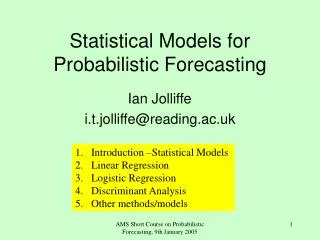
inferential statistics... Tools that permit you to generalize to a population based upon sample information More specifically indicates how likely you are to have obtained your results by chance
The problem of sampling error • Differences in samples due to random fluctuations within the population • By simulating the drawing of random samples of size N from a population with a specific mean and variance, we can explore: • (a) how much error we can expect on average in drawing a sample of that size and • (b) how much variation there will be on average in the errors observed
Sampling distribution: the distribution of a sample statistic (e.g., a mean) when sampled under known sampling conditions from a known population. Standard error is simply the standard deviation of the sample means (SEx) - tells the researcher by how much the researcher would expect the sample means to differ if the researcher used other samples from the same population a smaller standard error indicates less sampling error
a mathematical formula can be used to estimate the standard error... SD . SEx = √ N - 1
Sample size affects the size of the standard error of the mean The size of the population standard deviation also affects the standard error of the mean
Statistical Hypotheses: The null hypothesis (H0)... the difference between two sample means is due to random, chance, sampling error i.e., there is no true difference or relationship between parameters in the populations
The alternative hypothesis is aligned with the research hypothesis (H1), which is generally that: One mean will be higher than another There will be a relationship between variables Etc.
In rejecting the null hypothesis, you conclude that there was an effect or relationship i.e., that the effect/s observed are due to something other than random, chance, sampling error
There are four possibilities: 1. The null hypothesis is true and the researcher concludes that it is true A = B…a correct decision
2. The null hypothesis is false and the researcher concludes that it is false A ≠ B…a correct decision
3. The null hypothesis is true but the researcher concludes that it is false A = B…an incorrect decision
4. The null hypothesis is false but the researcher concludes that it is true A ≠ B…an incorrect decision
In quantitative research, a test of significance is used to determine whether to reject or fail to reject the null hypothesis This involves pre-selecting a level of probability, “α” (e.g., α = .05) that you will accept in determining whether to reject or fail to reject the null hypothesis
Steps in using inferential statistics 1. select the test of significance 2. determine whether significance test will be two-tailed or one tailed 3. select α (alpha), the probability level 4. compute the test of significance
Significance tests statistical procedures that enable the researcher to determine if there was a real difference between the sample means different tests of significance should be used depending on the scale of measurement represented by the data, number of groups being compared or associated
Parametric vs. Non-parametric Tests • parametric test Assumes that the variable measured is normally distributed in the population The data must represent an interval or ratio scale of measurement
The selection of participants is independent The variances of the population comparison groups are equal
A “more powerful” test in that it is more likely to reject a null hypothesis that is false, that is, the researcher is less likely to commit a Type II error, and depends on the four factors discussed yesterday
A nonparametric test: makes no assumption about the distribution of the variable in the population, that is, the shape of the distribution
These are used when the data represent a nominal or ordinal scale, when a parametric assumption has been greatly violated, or when the nature of the distribution is not known
A “less powerful” test in that it is less likely to reject a null hypothesis at a given level of significance
Common tests of significance are: Correlation t-test ANOVA Chi Square
Correlation What is the relationship between two variables of interest, e.g., high school performance and university performance?
Correlation Coefficient Measures whether two variables change in a related way Can be positive (max +1.00) Can be negative (min -1.00) Can be zero, indicating that the variables are not related (0.0)
T-tests • t-tests: Are used to determine whether the difference between two sample means is likely to reflect a real population difference
Compare the actual mean difference observed to the difference expected by chance Forms a ratio in which the numerator is the difference between the sample means and the denominator is the chance difference that would be expected if the null hypothesis were true
After the numerator is divided by the denominator, the resulting t value is compared to a theoretical sampling distribution (of t), against the probability level and the degrees of freedom
…if the t value is equal to or greater than a certain critical level, then the null hypothesis is rejected because the difference is greater than would be expected due to chance
two types of t-test: the t-test for independent samples (randomly formed) the t-test for related samples (e.g., performance on a pre-/post- test, different treatments)
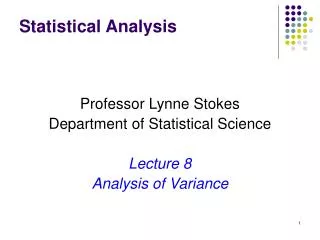
Analysis of Variance This is used to determine whether two or more means are significantly different at a selected probability level This avoids the need to compute multiple t-tests to compare groups – important for maintaining overall alpha level
The basic approach of ANOVA is that total variation, or variance, can be divided or “partitioned” into two sources • treatment variance (“between groups,” variance caused by the treatment groups) and • error variance (“within groups” variance)
The F ratio represents the ratio of treatment variance as the numerator (between group variance) and error variance as the denominator (within group variance)
A key assumption is that randomly formed groups of participants are chosen and are essentially the same at the beginning of a study on a measure of the dependent variable
If the treatment variance is sufficiently larger than the error variance, a significant F ratio results, that is, the null hypothesis is rejected and it is concluded that the treatment had a significant effect on the dependent variable
If the treatment variance is not sufficiently larger than the error variance, an non-significant F ratio results, that is, the null hypothesis is not rejected and it is concluded that the treatment had no significant effect on the dependent variable
When the F ratio is significant and more than two means are involved, researchers can use multiple comparison procedures (e.g., Scheffé test, Tukey’s HSD test, Duncan’s multiple range test) to look at differences between specific pairs of means
Assumptions for analysis of variance • Groups randomly and independently sampled • Homogeneity of variance • Normality • Set of groups fixed (rather than random)
Two-factor analysis of variance • Basis of two-factor classifications • Main effects and interactions • Assumptions and conditions • Random and independent sampling • Normality • Homogeneity of variance • Fixed levels • Equal number of cases in cells • Cell mean comparisons