Download
1 / 6
60 likes | 167 Views
Sap Flow Comparison. TDPs 12.7 cm diam. Dynagages 5 cm diam. 2.1 cm diam. Putting It All Together. Measure Test Trees Cross-Sectional Areas. Sap Flow/Stem Area = 0.203 L/cm 2 /day. Measure Average Daily Sap Flow for Test Trees. Indexing to Stand - Trunk Cross-Sectional Area

E N D
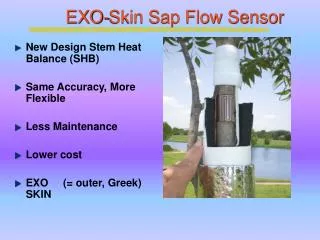
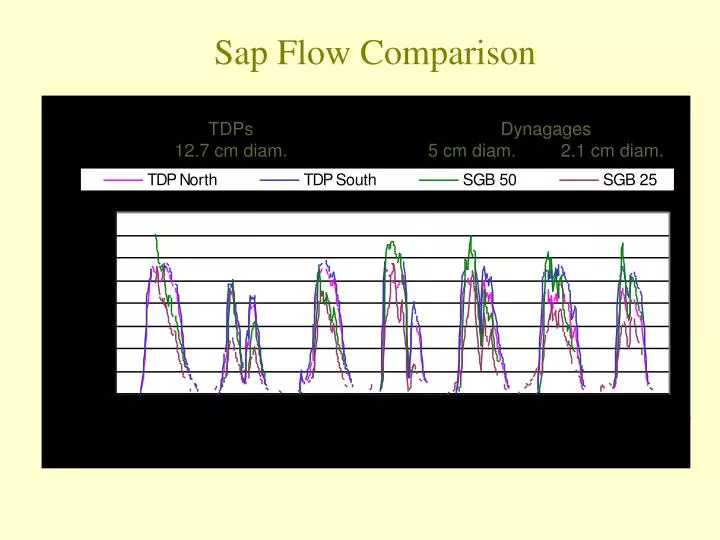
Sap Flow Comparison TDPs 12.7 cm diam. Dynagages 5 cm diam. 2.1 cm diam.
Putting It All Together Measure Test Trees Cross-Sectional Areas Sap Flow/Stem Area = 0.203 L/cm2/day Measure Average Daily Sap Flow for Test Trees Indexing to Stand - Trunk Cross-Sectional Area 61.9 cm2 x0.203 L/cm2/day = 12.6 L/day Measure Stand Trees Cross-Sectional Area 705 Trees averaging 61.9 cm2
Putting It All Together (cont.) Sap Flow/Land Area 12.6 L/d x 877 trees = 11,000 L/ha/d (1.1 mm/day) Measure Trees/Land Area 3m x 3m and 6m x 3m result in 877 trees/ha Measure Weather Station ETo 4.4 mm/day Index Sap Flow / ETo = KC Crop Coefficient 1.1 mm/d / 4.4 mm/d = 0.25 Apply Crop Coefficient For Seasonal Water Use Tot. seasonal ET x KC 858 mm x 0.25 = 215 mm (2,150,000 L/ha) The values shown above are averaged from July 23 through August 29, 2004 data. Modified from Dynamax
Conclusions • Sap flow monitoring quantifies and adds confidence to remediation predictions • Trees in X-740 Phytoremediation Area remove 11,000 liters of water/hectare/day (1176 gal/acre/day) • Total water consumption during 2004 growing season is 2,146,000 liters/hectare (229,000 gal/acre) • Results and experience from X-740 may be used to refine assumptions and approach at X-749/X-120 area
Future Work • Continue sap flow monitoring to determine groundwater usage by the trees • Conduct soil boring program to determine root extent • Collect additional tree core samples • Finalize hydrologic budget to determine groundwater extraction rate • Update groundwater flow model to better predict remediation