Download
1 / 17
180 likes | 399 Views
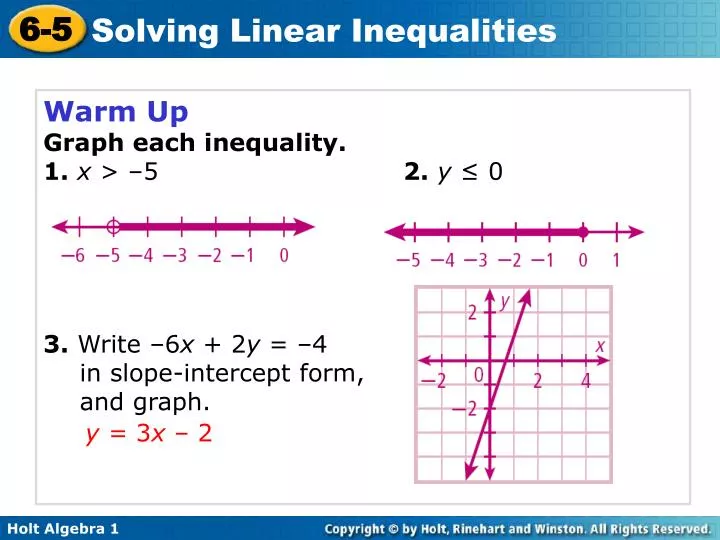
Warm Up Graph each inequality. 1. x > –5 2. y ≤ 0 3. Write – 6 x + 2 y = – 4 in slope-intercept form, and graph. y = 3 x – 2. Learning Target. Students will be able to: Graph and solve linear inequalities in two variables. y < 2 x + 1. 4 2( –2 ) + 1. 4 –4 + 1.

E N D
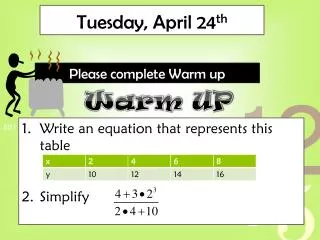
Warm Up Graph each inequality. 1. x > –5 2.y ≤ 0 3. Write –6x + 2y = –4 in slope-intercept form, and graph. y = 3x – 2
Learning Target Students will be able to: Graph and solve linear inequalities in two variables.
y < 2x + 1 4 2(–2) + 1 4 –4 + 1 4 –3 < Tell whether the ordered pair is a solution of the inequality. (–2, 4); y < 2x + 1 (–2, 4) is not a solution.
y > x − 4 1 3 – 4 > 1 – 1 (3, 1); y > x –4 (3, 1) is a solution.
1 1 – 7 5 4 + 1 55 < 1–6 > a. (4, 5); y < x + 1 b. (1, 1); y > x – 7 y < x + 1 y > x – 7 (1, 1) is a solution. (4, 5) is not a solution.
A linear inequality describes a region of a coordinate plane called a half-plane. All points in the region are solutions of the linear inequality. The boundary line of the region is the graph of the related equation.
Solve the inequality for y (slope-intercept form). Step 1 Graph the boundary line. Use a solid line for ≤ or ≥. Use a dashed line for < or >. Step 2 Shade the half-plane above the line for y > or ≥. Shade the half-plane below the line for y < or y ≤. Check your answer. Step 3 Graphing Linear Inequalities
Checky 2x –3 0 2(0) – 3 0 –3 Graph the solutions of the linear inequality. y 2x –3
Helpful Hint The point (0, 0) is a good test point to use if it does not lie on the boundary line.
0(0) – 4 0 –4 0 –4 > Graph the solutions of the linear inequality. 5x + 2y > –8 Check
Graph the solutions of the linear inequality. 2x – y –4 > 0 Check
y ≥ x + 1 Check 0 (0) + 1 0 0 + 1 0 ≥ 1 Graph the solutions of the linear inequality.
Ada has at most 285 beads to make jewelry. A necklace requires 40 beads, and a bracelet requires 15 beads. Write a linear inequality to describe the situation. Let x represent the number of necklaces and y the number of bracelets.
Solve for y and graph. # of bracelets Remember, Ada can only use whole numbers for x and y. In Algebra 2 we will determine which of those points maximizes profit! # of necklaces