Download
1 / 22
220 likes | 400 Views
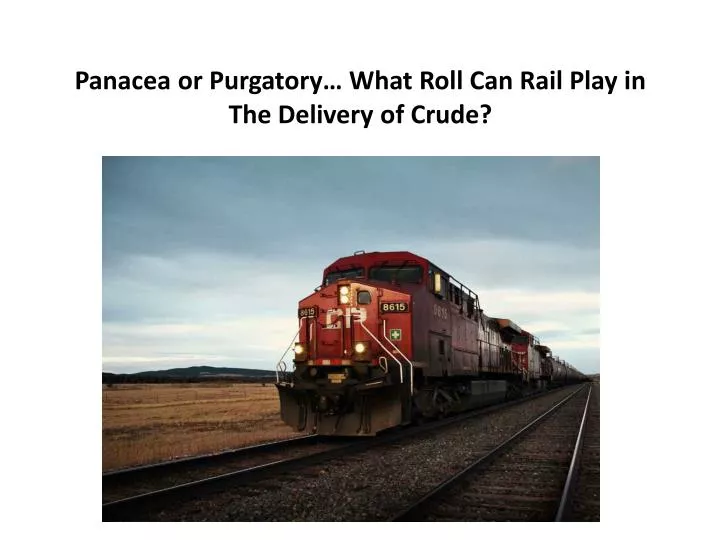
Panacea or Purgatory… What Roll Can Rail Play in The Delivery of Crude?. Discussion Agenda. A ssumptions. Growth of Canadian oil supply Key demand growth areas Market structure: pricing Strategic factors for sustainable crude shipments by rail Market access: Pipeline reach v. rail reach

E N D
Panacea or Purgatory… What Roll Can Rail Play in The Delivery of Crude?
DiscussionAgenda • Assumptions • Growth of Canadian oil supply • Key demand growth areas • Market structure: pricing • Strategic factors for sustainable crude shipments by rail • Market access: Pipeline reach v. rail reach • Pipeline v. Rail business model • Comparative infrastructure requirements • Public perception and regulatory considerations: Pipeline v. rail • Cost structure: focus factors to enhance competitiveness and sustainability of crude by rail • Channel-to-market cost structure: “cost to serve” • Rail factors that reduce channel-to-market cost • Pipeline v. rail infrastructure requirements • Efficiency factors; challenges & considerations for crude by rail • Strategic conclusions regarding crude by rail
Assumptions:WesternCanadaOilProductionForecast THOUSANDBPD 7,000 6,000 Forecast 5,000 Total Western Canada projected oil production exceeds 6%AGR through 2020, in spite of declining conventional oil production 4,000 3,000 2,000 1,000 0 2011 2012 2017 2018 2021 2022 2025 2010 2013 2014 2015 2016 2019 2020 2023 2024 2026 2027 2028 2029 2030 Western Canada Light and Medium Canada Oil Sands Mining AB & SK Conventional Heavy Canada Oil Sands In-Situ Source: CAPP; “2012 Crude Oil Forecast, Markets & Pipeline
Assumptions:GrowingExportDemand THOUSANDBPD 1,200 Canadian Oil Exports to USA have grown at 4.3% AAGR since 2000, with accelerated growth at 6.5% AAGR in last 3 years 1,100 1,000 900 800 700 600 2000 2001 2002 2003 2004 2005 2006 2007 2008 2009 2010 2011 2012 Source: CAPP; “2012 Crude Oil Forecast, Markets & Pipeline
Assumptions:OilDemandbyRegion US Canada Other 54% 43% 3% Source% PADDII Sources:USEIA,StatisticsCanada
Assumptions:RegionalBenchmarkPricing Jan 28 Crude Prices relative to WTI WCS($32) Midcontinent PL network and reversed central Canada PL cannot supply east coast: PL by rail demand sustainable Export demand & west coast refinery demand compared to declining supply support oil-by- rail growth Bakken($3.5) ANS+$17 Brent+$17 SJVH+$12 WTI$96 WCS = Western Canada Select (increasing) ANS = Alaska North Slope (declining) SJVH = San Joaquin Valley Heavy Maya = Mexican Maya (declining) LLS = Louisiana Light Sweet Source: CAPP, Bloomberg
PipelineBusinessModel • Producer • Transportation& terminallingcost variesby • Foundingor non-foundingshipperstatus • Distance • Intermediateservices (I.e.,blending) Pipeline ortruck IntermediateTerminal • Generallylong-termcommitments • Fixed destinationoptions • Workingcapital Pipeline • Residence time to market = 4 – 8 weeks • Substantial working capital in line fill DestinationTerminal • “All in” cost to move oil to market: • $8 – $12 USD/BBL or is it? Pipeline Refinery
Bitumentransportcostishigher thanquotedtollsfor30/70dilbit RAILIS LESS GrizzlyOilSands
PipelineBusinessModel • Four principal pipeline systems originate from Edmonton/Hardisty; Combined takeaway capacity = 3.5 Million BPD • Enbridge Mainline: 2.3 million KBPD • Kinder Morgan Trans Mountain: 300 KBPD; Kinder Morgan Express: 280 KBPD • Trans Canada Corporation’s Keystone Phase 1&2 : 590 KBPD • Proposed expansions (not approved) = 1.9 Million BPD • Enbridge Northern Gateway: • Bruderheim to Kitimat 525-850 KBPD; Completion 2018? • Public acceptance/project approval in question • Enbridge Alberta Clipper: • Hardisty to Superior, WI: increase 450 kbld to 570 KBPD • Southern Access downstream of Clipper: increase from 400 KBPD to 560 KBPD; 2014 • Trans Canada Keystone Expansion: increase to 835 KBPD; Completion 2015? • Kinder Morgan Trans Mountain: increase to 750 KBPD; Completion 2017? • Public acceptance/project approval in question • All pipelines move product to PADD II, PADD III or BC coast for export Sources: CAPP,Publicly available Information
PipelineBusiness Model: Advantages • Established mode of transporting oil to market • Efficient for rateable high volume shipments • Long-term channel-to-market cost structure certainty • Cheapest way to move standard grades of oil to pipeline accessible markets
Pipeline Business Model: Disadvantages • Two-tier pricing structure • Advantaged “founding shipper” pricing requires long-term take-or-pay commitment • Pricing for non-founding shippers materially higher • Origin and destinations are fixed and inflexible: no market options • Ongoing opportunity costs incurred for not having a flexible channel-to-market • Oil transactions are limited to refineries on the pipeline • Pipeline specifications are fixed and commoditized • No “boutique” niche product opportunities • Diluent required to transport bitumen • Pipeline outages constrain production and/or depress oil prices • Fully transparent pricing market enhances buyer power • Pipeline transit is slower than rail: higher working capital cost
RailBusinessModel • Transportation& terminallingcosts vary by Producer • Railcar cost: railcar lease buying power • Distance, source and destination (rail route) • Pipeline v. truck to source terminal • Trucking distance • Rail carrier competitive tension • Freight buying power and shipment volume • Backhaul or no backhaul (truck and/or railcar) • Railcar payload: API 8 = 500 BPRC; API 18 = 600 BPRC; dilbit can move with little or no diluent Potential diluent backhaul Pipeline or truck • Generally short-tomid-termcommitments Source Terminal • Terminalcommitment • Railcarleasecommitment Potential diluent backhaul • Flexible destination options • – Some products require steaming at destination • Working capital en route 5 – 14 days • Cost to move oil to market: • $15-20 USD/BBL Rail to Refinery Refinery
RailBusiness Model: Wide Range of Destination Options • Edmonton to Chicago (CN and CPR): • Chicago: Connect south to USGC or east to US eastern seaboard • Edmonton to Eastern Canada destinations (CN and CPR): • Ontario (CN & CPR) • PQ (CN & CPR) • New Brunswick (CN) • Eastern US destinations direct (CN and CPR) • West to Vancouver and Asia (CN and CPR) • South to PADD III, PADD II, California (CPR to BNSF) • South to Minneapolis to Union Pacific & western US destinations (CN & CPR) • South to Kansas City to KCS & USGC destinations (CPR) • CN connections to multiple US destinations through Noyes, MN; Superior, WI; Buffalo, NY • CN direct to USGC destinations
Rail Business Model: Advantages • Flexible market access facilitates capturing benchmark pricing differentials • Scalable from 600 to 60,000 BBL per shipment • Ability to preserve “niche” product specifications – less commoditization • Ability to ship bitumen and very heavy conventional crudes with little or no diluent • Shipper anonymity – not a fully transparent pricing market • No “public consultation” process to initiate shipping • Lower capital cost to support rail channel-to market, therefore shorter expected commitments than pipeline • Opportunity to enhance channel-to-market reliability with multiple serving railroads • Fast shipment time: 5-14 days to market • Proven model: Bakken success
Rail Business Model: Capturing the Oil Price Spread WCS Discount v. WTI USD % WTI USD/BBL USD/CAD WTI WCS Source: Bloomberg IndustryBlendedIndex
RailBusiness Model: Capturing the Oil Price Spread
RailBusiness Model: Disadvantages • More expensive to move commodity oil to markets that are well served by high-volume pipelines • Tank car availability impacts time required to initiate shipments • Tank car commitments up to 7 years may be required • Truck availability (if trucking to source terminal) • “Emerging” market in Western Canada; limited capacity • “Emerging” (growing) destination unloading capacity • Oil producer may not have in-house rail transport expertise and buying power • Supply chain costs negotiated for 1 – 5 years
Comparative Infrastructure Requirements • Pipeline: • Multi-billion dollar investment • Substantial public interface, approval and permitting required • 3 – 10 year lead time • Rail: • $1 - $150 Million investment (depending on throughput capacity, storage, pipeline connection, etc.) • Limited public interface, approval and permitting required • 3 – 24 months lead time
Public Perception & Regulatory Considerations Pipeline:Rail: • Substantial, high visibility public opposition to new pipeline projects • Regulatory hurdles to new pipeline projects • Long project lead times • Pipeline spills can result in large quantities of product loss, environmental impact and high visibility • Rail is an accepted and proven mode of transport with significant track infrastructure in place across North America • Proven rail networks efficiently move other energy commodities such as coal • Product loss in rail incidents has been typically limited to 1 to several railcars; limited loss, limited environmental impact, limited visibility
Considerations for developing Rail Facility • Design for minimizing cost, maximizing efficiency: • 24 x 7 x 365 operation • Minimum tank car residence time to maximize railcar utilization • Pipeline-to-rail staging tank capacity • On-site storage capacity for products delivered by truck • High truck unloading capacity to minimize truck waiting time • High throughput efficiency to minimize railcar “dwell” time • Dual serving railroads • Geographic location • Accurate billing meters • Ability to facilitate truck and/or railcar backhauls • Ability to handle “niche” products such as very heavy conventional and minimally diluted bitumen • Third-party logistics management, railcar supply, repair and cleaning service offerings
Conclusions:StrategicOil-by-RailApproach • Rail-to-market is a viable long-term oil marketing strategy • Not all oil markets are competitive for rail delivery of oil • Oil-by-rail costs can be optimized by accessing “buyer power” through third-party logistics management services • Oil netbacks can be enhanced for sellers and purchase prices optimized for buyers by: • Target rail shipments to under-serviced pipeline markets • Target rail shipments to markets where benchmark price differentials enhance oil value at delivery point • Moving oil from niche producers without pipeline access and niche producers with unique product specifications by rail • Developing multi-mode marketing strategies to secure the advantages of both pipeline and rail shipments
TRANSPORTINHEAVY pipeline70% generalpurpose85%-90% insulated95%-100%