Download
1 / 8
90 likes | 194 Views
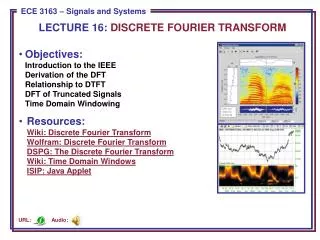
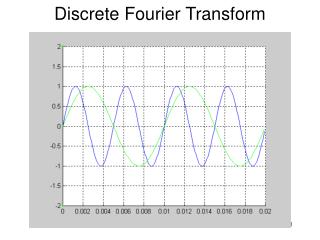
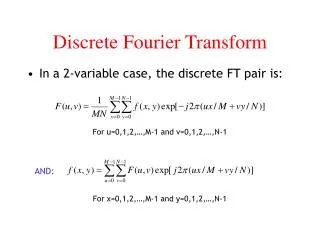
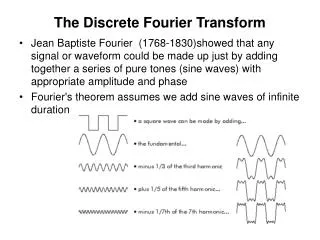
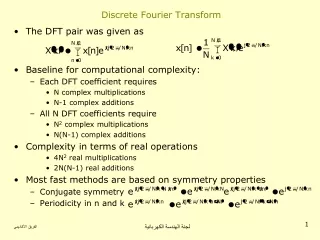
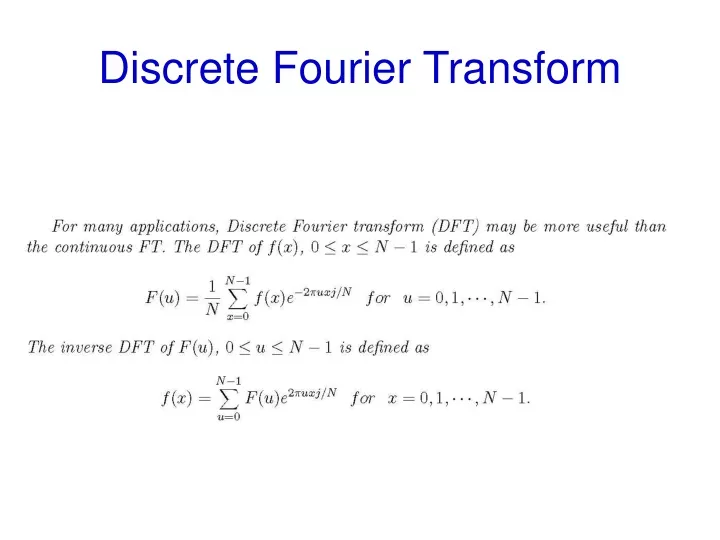
Discrete Fourier Transform. FFT and Its Applications.

E N D
FFT and Its Applications FFTSHIFT Shift zero-frequency component to the center of spectrum. For vectors, FFTSHIFT(X) swaps the left and right halves of X. For matrices, FFTSHIFT(X) swaps the first and third quadrants and the second and fourth quadrants. For N-D arrays, FFTSHIFT(X) swaps "half-spaces" of X along each dimension.
fftBox.m – Plot Fourier Spectrum • % • % Script file: fftBox.m • % Fourier Spectrum Plot of Box function • % • X1=linspace(0,1,17); • Y1=ones(1,length(X1)); • X2=linspace(1,16,241); • Y2=zeros(1,length(X2)); • X=[X1 X2]; Y=[Y1 Y2]; • W=abs(fftshift(fft(Y))); • subplot(2,1,1) • plot(X,Y,'r'); axis([0 16, 0,1.2]); title('Box function') • subplot(2,1,2) • plot(W,'b-'); • title('Fourier Spectrum of Box function')
Example of 2-D FFT Matlab Code • % Script file: fourier.m - 2D Fourier Transform • % Pictures on P.113 of Gonzalez, Woods, Eddins • m=128; n=128; • f=zeros(m,n); • f(56:71,48:79)=255; • F0=fft2(f); S0=abs(F0); • Fc=fftshift(fft2(f)); Sc=abs(Fc); • Fd=fft2(fftshift(f)); Sd=log(1+abs(Fc)); • subplot(2,2,1) • imshow(f,[]) • subplot(2,2,2) • imshow(S0,[]) • subplot(2,2,3) • imshow(Sc,[ ]) • subplot(2,2,4) • imshow(Sd,[ ])