Download
1 / 8
80 likes | 214 Views
The Link Between Childhood Poverty and API Scores. by Lobna Hewedi. Current Research. Scholarly work agrees that childhood poverty impacts a child’s quality of life Low Birth Rate Poor Health Poor Academic Achievement Mental Disorders Early Childhood Death

E N D
The Link Between Childhood Poverty and API Scores by Lobna Hewedi
Current Research • Scholarly work agrees that childhood poverty impacts a child’s quality of life • Low Birth Rate • Poor Health • Poor Academic Achievement • Mental Disorders • Early Childhood Death • A school with a high concentration of poverty is one in which more than 40% of its students quality for free or reduced-priced lunch.
Causes of Childhood Poverty Include: • Families headed by females • Increases in racial and ethnic diversity • Stalled economic growth • Increases in economic inequality.
Effects of Childhood Poverty: • 28.8% have repeated a grade (2x as likely as non-poor) • 11.9% have been expelled or suspended previously (2x as likely as non-poor) • 21% were highschool dropouts (2x as likely as non-poor) • Poor children are 1.3x as likely as non-poor children to experience learning disabilities and developmental delays • Poorer children scored between 6 and 13 points lower on various standardized tests of IQ verbal ability and achievement, a difference that might mean the difference between being placed in a special education class or not • Change schools more frequently
A poor student in a school with few poor students has a better chance of good academic outcomes than does a non-poor student in a school where most of the students live in poverty
Strategies to Alleviate Poverty: • A 10% increase in family income is associated with a 2% increase in number of school years completed (job training, literacy programs, etc) • Programs focused on rapid job placement • Reducing the federal tax burden on poor families • Large-scale public jobs programs • Promote housing mobility programs to encourage relocating to middle-income neighborhoods
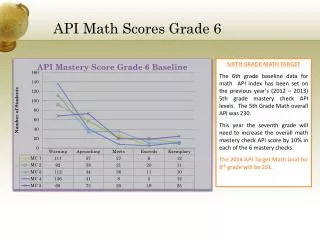
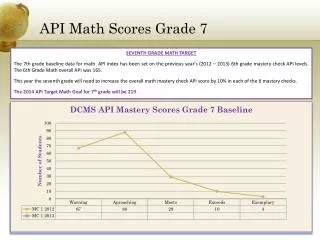
Findings • R-squared = 30% • 30% of the variation in API is due to poverty. There still remains 70% of other factors. • B value • 1201.865 (constant) • -.314 • Correlation is significant at the .01 level
Conclusion • The U.S is at the top of the list of industrialized nations when it comes to the number of poor children. • Not a fair playing field for schools. • Curriculum narrowly focused. • Poverty brings other issues that when combined, have a negative impact on ability to have a quality education.