Download
1 / 29
290 likes | 413 Views
Understanding the link between poverty and human development: insights from brain scans. Bobbi Wolfe University of Wisconsin-Madison & Melbourne Institute Workshop in the Economics of Health and Aging January 31, 2014. Overview.

E N D
Understanding the link between poverty and human development: insights from brain scans. Bobbi Wolfe University of Wisconsin-Madison & Melbourne Institute Workshop in the Economics of Health and Aging January 31, 2014
Overview • The income gradient in health is well documented: children in poorer households tend to have poorer health. • The income cognitive gap in early school performance is also well documented with many programs targeted at low income pre-school age children. • How does poverty lead to these outcomes? Current research on brains and on bio-markers are an attempt to get some insight into the “black box” linking poverty to poor health and lower school performance. • The research presented below attempts to analyze the link between poverty and critical regions of the brain and then to link poverty and the size of these regions to measures of cognitive development.
New Approach: Use of brain scans to study if low income tied to differential development of regions of children’s brains that develop after first few years of life.Hanson, J., S Pollak, A Chandra, B Wolfe. 2010 Existing Evidence: Research involving nonhuman animals (where the early environment can be experimentally manipulated, controlled, and precisely measured) reveals that environmental circumstances, particularly environmental stimulation or enrichment, parental nurturance, and early life stress, can all significantly affect brain growth and functioning (Rutter, 2012).
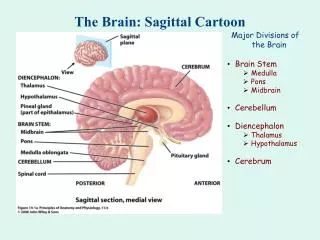
Selecting brain regions of interest • Select regions of interest based on two criteria: • (1) those that have a pro- tracted period of post-natal development and, therefore, are more likely to be vulnerable to environmental experience • (2) those thought to be critical for sustained attention, plan- ning, and cognitive flexibility, all of which may have implications for learning and academic functioning. • Focus on gray matter, a type of tissue which is less heritable than other brain tissues, such as white matter (Gilmore et al., 2010).
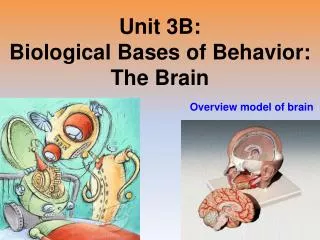
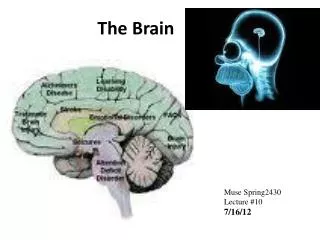
The brain can be divided into two hemispheres (right and left), four lobes (occipital, parietal, temporal, and frontal), and three types of tissue (gray matter, white matter, and cerebrospinal fluid . The temporal lobe contains the amygdala and hippocampus.
This Study • 1. Examine the influence of poverty on anatomical brain development using (relatively) large sample of children and adolescents • Establish a reference for normative brain development • Focus on regions of the brain critical for scholastic achievement, adjusting for developmental norms • 2. Explore role of differences in brain structure and development as potential channel underlying income-achievement gap • Tie regions of the brain to performance on standardized tests • Wechsler Abbreviated Scale of Intelligence (WASI) Woodcock-Johnson III Tests of Achievement (WJ-III)
Tests of Achievement used • The Wechsler Abbreviated Scale of Intelligence WASI consists of four subtests that provide composite scores of verbal comprehension and perceptual reasoning abilities. The Verbal IQ (VIQ) measures word knowledge along with verbal reasoning and concept formation. The Performance IQ (PIQ) measures visual information processing, abstract reasoning, and visual-motor coordination. A Full Scale IQ score combines measures captured in the VIQ and PIQ (Corporation, 1999). • The Woodcock-Johnson III (WJ-III) Tests of Achievement ( WJ-III 0 Letter Word Identification, Passage Comprehension, and Math Computations tests are designed to measure a child’s language and math achievement. The Letter Word Identification and Passage Comprehension tests measure a child’s word identification skills and ability to understand written text. The Math Computations test measures a student’s ability to perform paper and pencil math computations.(Woodcock, McGrew and Mather, 2001). • Both WASI and WJ-III assessments are standardized with a mean of 100 and a standard deviation of 15 (Table 2). Mean scores for Pediatric MRI Study sample children are slightly above national norms. Low performance (standardized scores below 70) on achievement indices was exclusionary.
DataNIH MRI Study of Normal Brain Development (Pediatric MRI Study) • I Developed to aid in understanding brain maturation in • \healthy, typically-developing" infants, children, & adults • I Exclusion criteria: prenatal/birth/perinatal histories, medicaland psychiatric disorders, low IQ, and family medical history • I Objective 1: children and adolescents 4 to 18 years • I Size and scope unprecedented • I 823 observations from 389 unique children • I 301 children (77% of sample) followed longitudinally • I Anatomic MRI scans, cognitive & behavioral assessments, • demographic characteristics • I Scans \interpreted" using structural imaging techniques • (voxel based morphometry)
Socioeconomic Status and Brain Development – Simple relationships Brain development measures normed. Volumes measured as percentages of sex-age specific normes. Clustered SE in parenthesis.
SES, Anatomical Brain Development and Verbal Achievement. Children from low income families were found to have GM 6 % below norm and Hippocampus GM 8.4% below norm.
SES, Anatomical Brain Development and Performance Achievement Children from low income families were found to have GM 6 % below norm and Hippocampus GM 8.4% below norm.
SES, Anatomical Brain Development and Achievement Frontal Lobe and Temporal Lobe GM
Acknowledgements • Thanks to co-authors, Nicole Hair, Seth Pollak and Jamie Hanson • Thanks to Russell Sage Foundation for support • Thanks to you for your attention and suggestions