Download
1 / 8
100 likes | 281 Views
Contour Lines. Elevation on Topographic Maps. What is a contour line?. A contour line on a map is a line that joins points of equal elevation . If you walk along a contour line you neither gain or lose elevation. Measured in metres (in Canada) or feet (in USA). Contour Interval.

E N D
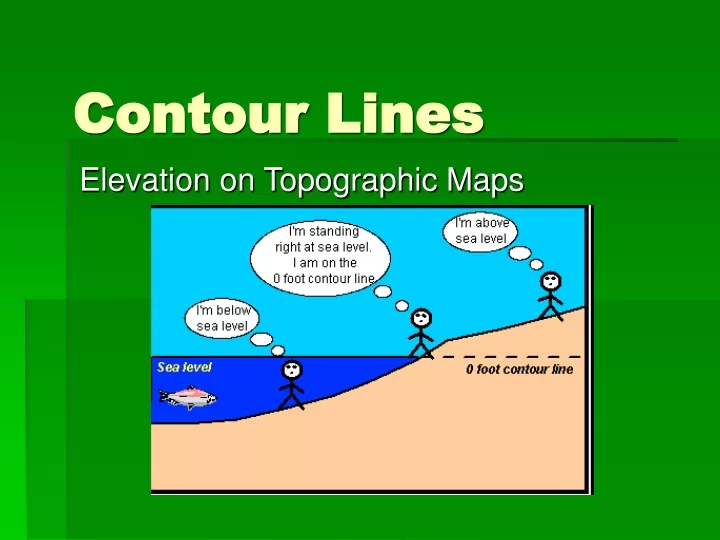
Contour Lines Elevation on Topographic Maps
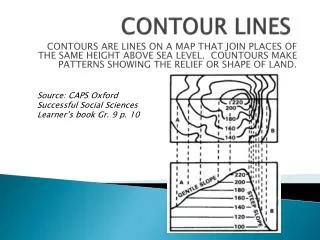
What is a contour line? • A contour line on a map is a line that joins points of equal elevation. • If you walk along a contour line you neither gain or lose elevation. • Measured in metres (in Canada) or feet (in USA)
Contour Interval • When drawing in contour lines one must first know the designated contour interval which is the difference in elevation between two successive contour lines. • Contour intervals vary from one map to another depending upon the landscape presented. • What is the contour interval on this map?
Contour line features… • When contour lines are spaced further apart, they represent a gentle slope. • Closely-spaced contour lines = steep slope
Some rules for understand topographic maps. • 1. Contour lines never cross.2. When a contour line crosses a river (stream) the contour line forms a "V". The "V" always points upstream. This tells you which direction the river is flowing. Remember water flows toward the lowest elevation.3. The slope (gradient) is steepest when the contour lines are close together and gradual when they are far apart. 4. Contour lines form circles or are lines that go to the edge of the map. The higher elevations on a map are found where the contour lines make smaller closed circles. 5. A depression on a contour map is shown by contour lines with small marks pointing toward the lowest point of the depression.
Contour Maps to Relief Maps • Contour lines help show the shape of the land • By layering contour lines one on top of another, we can create a relief map. • Relief maps are three dimensional maps that depict the topography of the earth’s surface.
Challenger BC Relief Map • The Challenger Relief Map of British Columbia is a monumental, hand built 80-by-76 foot topographic map of the province. Built by George Challenger and his family from 1947 to 1954, it features all of B.C.'s mountains, lakes, rivers and valleys in exact-scaled topographical detail.Residing in the British Columbia Pavilion at the PNE in Vancouver from 1954 to 1997 it was viewed by millions of visitors. • The Guinness Book of Records cites the Challenger Map as the largest of its' kind in the world. The map in its entirety occupies 6,080 square feet (1,850 square metres) of space.