Download
1 / 37
370 likes | 488 Views
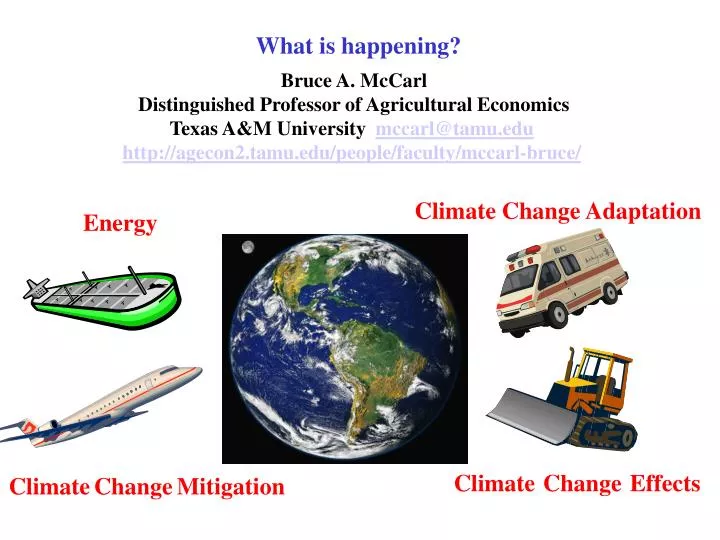
What is happening?. Bruce A. McCarl Distinguished Professor of Agricultural Economics Texas A&M University mccarl@tamu.edu http://agecon2.tamu.edu/people/faculty/mccarl-bruce/. Climate Change Adaptation. Energy. Climate Change Effects. Climate Change Mitigation. Basic Resources.

E N D
What is happening? Bruce A. McCarl Distinguished Professor of Agricultural Economics Texas A&M University mccarl@tamu.edu http://agecon2.tamu.edu/people/faculty/mccarl-bruce/ ClimateChangeAdaptation Energy ClimateChangeEffects ClimateChangeMitigation
Basic Resources Intergovernmental Panel on Climate Change. Climate Change 2007: Synthesis Report Summary for Policymakers, http://www.ipcc.ch/pdf/assessment-report/ar4/syr/ar4_syr_spm.pdf / . Intergovernmental Panel on Climate Change. IPCC Fourth Assessment Report” Working Group I Report "The Physical Science Basis“ http://www.ipcc.ch/ipccreports/ar4-wg1.htm Intergovernmental Panel on Climate Change. IPCC Fourth Assessment Report: Working Group II Report "Impacts, Adaptation and Vulnerability” http://www.ipcc.ch/ipccreports/ar4-wg2.htm Intergovernmental Panel on Climate Change. IPCC Fourth Assessment Report: Working Group III Report "Mitigation of Climate Change“ http://www.ipcc.ch/ipccreports/ar4-wg3.htm National Assessment Synthesis Team, US Global Change Research Program , Climate Change Impacts on the United States:The Potential Consequences of Climate Variability and Change Overview: 2000http://www.usgcrp.gov/usgcrp/Library/nationalassessment/overview.htm National Assessment Synthesis Team, US Global Change Research Program , Climate Change Impacts on the United States:The Potential Consequences of Climate Variability and Change Foundation: 2000http://www.usgcrp.gov/usgcrp/Library/nationalassessment/foundation.htm U.S. Climate Change Science Program (CCSP) Assessment reports http://www.climatescience.gov/Library/sap/sap-summary.php
What is Climate Change About? Climate change refers to any change in climate over time, whether due to natural variability or as a result of human activity. This usage differs from that in the Framework Convention on Climate Change, where climate change refers to a change of climate that is attributed directly or indirectly to human activity that alters the composition of the global atmosphere and that is in addition to natural climate variability observed over comparable time periods. Source : Intergovernmental Panel on Climate Change. IPCC Third Assessment Report – Synthesis Report, http://www.ipcc.ch/.
What is Climate Change About? 2010 combined global land and ocean surface temperature tied with 2005 as warmest on record, at 0.62°C (1.12°F) above the 20th century average 2010 global land surface temperature tied with 2005 as second warmest on record, at 0.96°C (1.73°F) above 20th century average. Warmest was 2007, at 0.99°C (1.78°F) above avg. 2010 Northern Hemisphere land-ocean surface temperature was warmest on record, at 0.73°C (1.31°F) above 20th century average. Southern Hemisphere was sixth warmest year on record. NOAA National Climatic Data Center, State of the Climate: Global Analysis for December 2010, published online January 2011, retrieved on January 17, 2011 from http://www.ncdc.noaa.gov/sotc/global/.
What is Climate Change About? http://www.ncdc.noaa.gov/sotc/global/2012/13
What is Climate Change About? • All of the 21st century years rank among the 13 warmest on record. • The year 2012 was the 36th consecutive year with global temperatures above the 20th century average. • The global average surface temperature in 2012 was the tenth warmest since 1880, 2010 was warmest. NOAA National Climatic Data Center, State of the Climate: Global
What is Climate Change About? http://www.ncdc.noaa.gov/sotc/global/2011/13
Degree of climate change 2012 is Hottest in North America
Degree of climate change 2012 is Hottest in North America
Degree of climate change 2012 is Hottest in North America
Degree of climate change What is happening up to now – Temperature since 1979 Texas in a relatively rapidly warming area within continental US http://ipcc-wg1.ucar.edu/wg1/Figures/AR4WG1_Ch03-Figs_2007-10-23.ppt#299,43,FAQ 3.1, Figure 1
What is Climate Change About? • The total temperature increase from 1850–1899 to 2001–2005 is 0.76°C [0.57°C to 0.95°C]. • Warming is unequivocal, as is now evident from observations of increases in global average air and ocean temperatures, widespread melting of snow and ice, and rising global average sea level • 11 of 12 years in 1995–2006 rank are among 12 warmest years in instrumental record since 1850. • 100-year linear trend (1906 to 2005) of 0.74°C [0.56°C to 0.92°C] is larger than the corresponding trend for 1901 to 2000. • 50 year warming trend (0.13°C [0.10°C to 0.16°C] per decade) is nearly twice that for last 100 years. • Analyses of proxy data for Northern Hemisphere indicate that increase in temperature in the 20th century is likely to have been the largest of any century during the past 1,000 years. http://ipcc-wg1.ucar.edu/wg1/Figures/AR4WG1_Ch03-Figs_2007-10-23.ppt#299,43,FAQ 3.1, Figure 1
Degree of climate change What is happening up to now – Land Figure TS.20. (Top) Records of Northern Hemisphere temperature variation during the last 1300 years with 12 reconstructions using multiple climate proxy records shown in colour and instrumental records shown in black. (Middle and Bottom) Locations of temperature-sensitive proxy records with data back to AD 1000 and AD 1500 (tree rings: brown triangles; boreholes: black circles; ice core/ice boreholes: blue stars; other records including low-resolution records: purple squares). Data sources are given in Table 6.1, Figure 6.10 and are discussed in Chapter 6. {Figures 6.10 and 6.11} Figure TS.20 Source : Intergovernmental Panel on Climate Change. IPCC Fourth Assessment Report WGI http://ipcc-wg1.ucar.edu/
Degree of climate change What is happening up to now – Ocean Temperature Ocean also shows temperature increase Source : Intergovernmental Panel on Climate Change. IPCC Fourth Assessment Report WGI http://ipcc-wg1.ucar.edu/
Degree of climate change What is happening up to now – Potential Precipitation Rainfall is increasing
What is Climate Change About? NOAA National Climatic Data Center, State of the Climate: Global Analysis for December 2010, published online January 2011, retrieved on January 17, 2011 from http://www.ncdc.noaa.gov/sotc/global/. Global precipitation in 2010 was well above the 1961–1990 average, ranking as the wettest on record since 1900.
Degree of climate change What is happening up to now -- Precipitation • Rainfall has become more concentrated and Texas/Brazil has such areas http://ipcc-wg1.ucar.edu/wg1/Figures/AR4WG1_Ch03-Figs_2007-10-23.ppt#296,40,Figure 3.39
Degree of climate change What is happening up to now -- Precipitation Texas has areas that had largest decrease in continental US http://ipcc-wg1.ucar.edu/wg1/Figures/AR4WG1_Ch03-Figs_2007-10-23.ppt#269,14,Figure 3.13
Degree of climate change What is happening up to now -- Drought Global Drought Hazard Frequency and Distribution, v1 (1980 – 2000) Doubled frequency http://sedac.ciesin.columbia.edu/data/set/ndh-drought-hazard-frequency-distribution ELEANOR J. BURKE, SIMON J. BROWN, AND NIKOLAOS CHRISTIDIS , Modeling the Recent Evolution of Global Drought and Projections for the Twenty-First Century with the Hadley Centre Climate Model
Climate Change and Extremes • Many extremes and their associated impacts are now changing. • For example, in recent decades most of North America has been • experiencing • More unusually hot days and nights, • Fewer unusually cold days and nights, and • Fewer frost days. • Heavy downpours have become more frequent and intense. • Droughts are becoming more severe in some regions, though there are no clear trends for North America as a whole. • The power and frequency of Atlantic hurricanes have increased substantially in recent decades, though North American mainland land-falling hurricanes do not appear to have increased over the past century. • Storm tracks are shifting northward and the strongest storms are becoming even stronger. http://www.climatescience.gov/Library/sap/sap3-3/final-report/default.htm
Climate Change and Extremes http://www.climatescience.gov/Library/sap/sap3-3/final-report/default.htm
Climate Change and Extremes The IPCC Special Report on Managing the Risks of Extreme Events and Disasters to Advance Climate Change Adaptation (forthcoming soon) http://ipcc-wg2.gov/SREX/ and http://ipcc-wg2.gov/SREX/images/uploads/IPCC_SREX_slide_deck.pdf
Degree of climate change What is happening up to now -- Disasters Disasters increasing Disasters expensive From Special Report of the Intergovernmental Panel on Climate Change, Managing the Risks of Extreme Events and Disasters to Advance Climate Change Adaptation
Degree of climate change What is happening up to now – Extreme Event Losses The IPCC Special Report on Managing the Risks of Extreme Events and Disasters to Advance Climate Change Adaptation (forthcoming soon) http://ipcc-wg2.gov/SREX/ and http://ipcc-wg2.gov/SREX/images/uploads/IPCC_SREX_slide_deck.pdf
Observed Changes in Oceans, Snow and other items
Degree of climate change What is happening up to now -- Other Numerous long-term changes in climate have been observed. These include changes in arctic temperatures and ice, widespread changes in precipitation amounts, ocean salinity, wind patterns and aspects of extreme weather including droughts, heavy precipitation, heat waves and the intensity of tropical cyclones. Arctic temperatures increased at almost twice the global average rate in past 100 years. Arctic temperatures have high decadal variability. Satellite data since 1978 show that annual average arctic sea ice extent has shrunk by 2.7 [2.1 to 3.3]% per decade, with larger decreases in summer of 7.4 [5.0 to 9.8]% per decade. Temperatures at the top of the permafrost layer have generally increased since 1980s (by up to 3°C). The maximum area covered by seasonally frozen ground has decreased by about 7% in the Northern Hemisphere since 1900 • Changes in precipitation and evaporation over the oceans are suggested by freshening of mid- and high latitude waters together with increased salinity in low latitude waters. Source : Intergovernmental Panel on Climate Change. IPCC Fourth Assessment Report WGI http://ipcc-wg1.ucar.edu/
Degree of climate change What is happening up to now – Sea Ice Scientists using satellite data have confirmed that the amount of sea ice that floats in the Arctic is much less than it used to be.In 2005, and all the way back to 2002, the amount of sea ice has been 20 percent less than the average amount seen normally between 1979 and 2000.Satellites helped scientists learn that there was about 502,000 square miles less sea ice each September since 2001 than there typically was in previous Septembers http://nsidc.org/data/seaice_index/ http://www.nasa.gov/vision/earth/environment/arcticice_decline.html
Degree of climate change What is happening up to now – Glaciers Glaciers are retreating almost everywhere around the world — including the Alps, Himalayas, Andes, Rockies, Alaska and Africa. Water supply source, Boulder CO, Arapaho Glacier, Colorado. Left: 1898. Right: 2003 http://climate.nasa.gov/stateOfFlux/ http://maps.grida.no/go/graphic/retreat-of-seven-andean-glaciers
Degree of climate change What is happening up to now – Hurricanes Source : Intergovernmental Panel on Climate Change. IPCC Fourth Assessment Report WGI http://ipcc-wg1.ucar.edu/
EVIDENCE OF GLOBAL WARMING The 12 warmest years since 1861 occurred between 1980 and 1998, decade of 1990 was the warmest in last 600 years, 18 of 20 warmest years in last 100 were in last 20. Global mean sea level has risen between 10 and 25 cm (18 cm average) during the last 100 years. Since 1850, European Alps glaciers have lost 30-40% of surface area and half of their volume. Similar trends found worldwide. Aerial surveys show that more than 11 cubic miles of ice is disappearing from the Greenland ice sheet annually, Readings of infrared light from the earth's surface in 1970 and 1997 found less was escaping into space in 1997. Disappearances of species of frogs and toads, upward shifts in the ranges of mountain birds, and declines in lizard population.
Climate Change is altering the planet Available observational evidence indicates that regional changes in climate, particularly increases in temperature, have already affected a diverse set of physical and biological systems in many parts of the world. Observed changes include Shrinkage of glaciers and sea ice Snow cover has decreased Thawing of permafrost, Later freezing and earlier break-up of ice on lakes/rivers Lengthening of mid- to high-latitude growing seasons Poleward and altitudinal shifts of plant and animal ranges, Declines of some plant and animal populations, Earlier flowering of trees, emergence of insects, and egg-laying in birds Global average sea level has risen and ocean heat content has increased