Download
1 / 6
80 likes | 1.31k Views
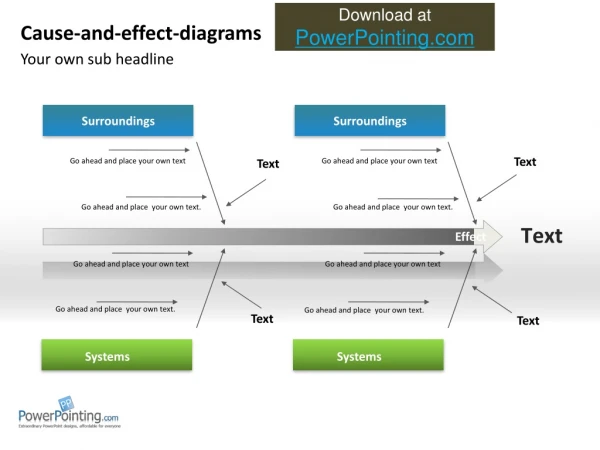
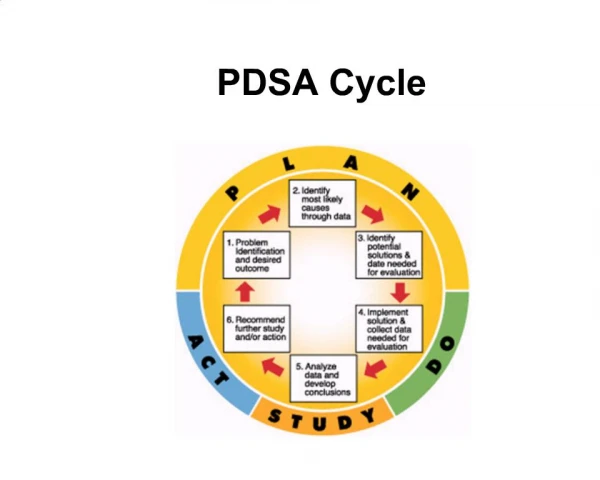
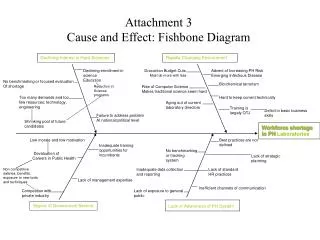
Where can you use the Fishbone Diagram in the PDSA Cycle?. a.k.a. Cause and Effect. Why Use the Fishbone in the Classroom. Categorize many potential causes of a problem or issue in an orderly way. It helps to analyze what is really happening in a process.

E N D
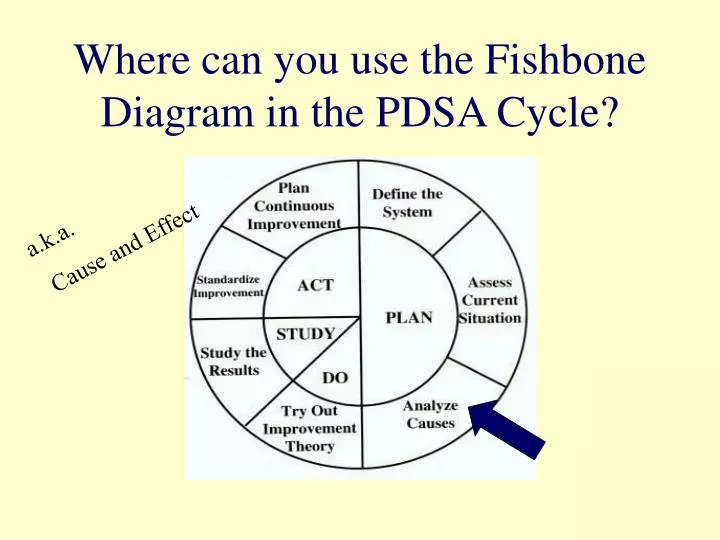
Where can you use the Fishbone Diagram in the PDSA Cycle? a.k.a. Cause and Effect
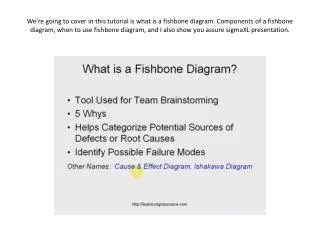
Why Use the Fishbone in the Classroom • Categorize many potential causes of a problem or issue in an orderly way. • It helps to analyze what is really happening in a process. • It can help students learn about new processes and procedures in the classroom or school setting.
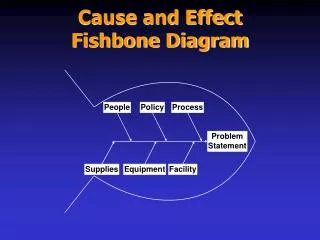
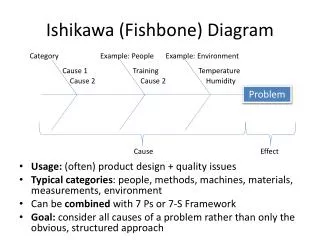
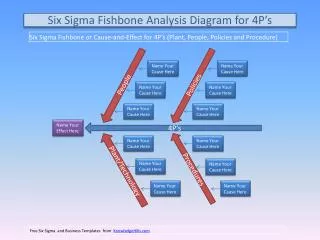
This is an example of a Fishbone: Executive Branch Legislative Branch Washington D.C. Judicial Branch Checks and Balances
Ways to use the (cause and effect) Fishbone Diagram • Why are students: not paying attention in class? forgetting their homework? doing the wrong assignment? being late to school? doing poorly on tests? missing school? taking too long to do an assignment? losing papers?
Things to remember about the Fishbone Diagram • There should be no judgments made about ideas offered from students. • Everyone will have an opinion about what causes a problem. Organizing these ideas improves the chance that good ideas can be tested. • Label the “main bones” of the diagram in ways that are best for your problem or event. • Use the Fishbone Diagram to help solve problems as well as making plans.
Relations Diagram v.s. Fishbone Diagram • Use the Relations Diagram when students are having trouble getting to the root problem because only symptoms seem to be apparent. • Use the FishboneDiagram when students have many ideas and or opinions about the causes of the problem.