Download
1 / 14
140 likes | 235 Views
Simple Chemical modeling of ozone sensitivity to NOx and VOCs in Atlanta. Jin Liao EAS 6410 04/24/2007. Outline. 1.Introduction 2. Troposphere ozone production mechanism in urban region 3. Simple Chemical modeling of ozone sensitivity to NOx and VOCs in Atlanta

E N D
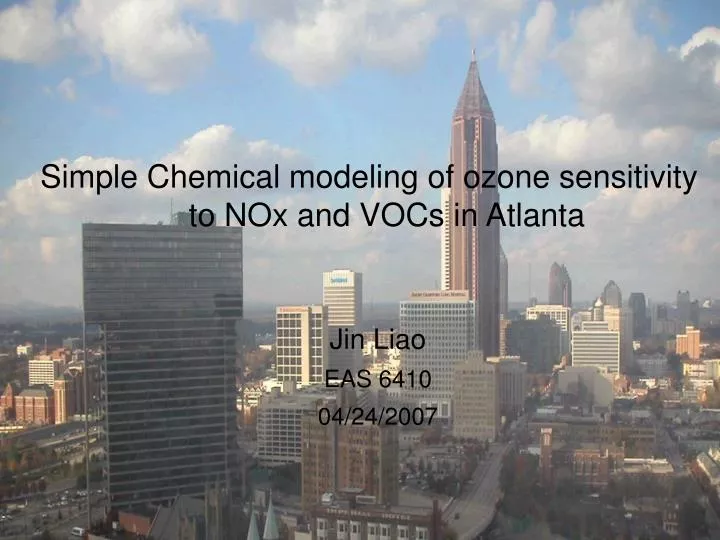
Simple Chemical modeling of ozone sensitivity to NOx and VOCs in Atlanta Jin Liao EAS 6410 04/24/2007
Outline 1.Introduction 2. Troposphere ozone production mechanism in urban region 3. Simple Chemical modeling of ozone sensitivity to NOx and VOCs in Atlanta 4. Modeling result and ozone control in Atlanta 5. Conclusion
The importance to control ozone in Atlanta Tropospheric Ozone : 1. Cause photochemical smog, toxic to ecosystem, destroy material such as rubber… Increase ground-level 2. A primary source of hydroxyl radicals ozone concentration 3. Greenhouse gas Ozone ---- one of the U.S. EPA’s six criteria pollutants and is regulated by a National Ambient Air Quality Standard. Atlanta---One of 77 nonattainment areas in former U.S. EPA standard The new U.S. EPA standard is more stringent.
Tg O3 yr-1 Sources 3400-5700 Chemical Production 300-4600 Transport from Stratosphere 400-1100 Sinks 3400-5700 Chemical loss 300-4200 Dry Deposition 500-1500 The budget of ozone in Troposphere Global models of tropospheric chemistry in a three-dimensional frame-work to estimate tropopheric O3 budget Chemical Production = Chemcial Loss Model only consider Chemical Process
hv NO2 OH Ozone hv NO HO2 VOCs HNO3 Emission Emission Troposphere O3 Production and Loss Mechanism in Urban Region The emissions of NO and VOCs from the surface drive this cycle to produce o3. To control the local ozone concentration, it is necessary to quantify the ozone concentration relative to NOx and VOCs concentration.
Simple Chemical modeling of ozone sensitivity to NOx and VOCs in Atlanta • Basic modeling conception: • Only consider chemical production and loss reaction processes • We can determine the maximum ozone concentration with initial • NOx ,VOCs concentrations and photolysis rate Acuchem Input File(reaction mechanism and reaction rates) Process(solves differential equations) Output File(species concentration VS. reaction time) MATLAB Peak Ozone concentration Isopleths
This input file includes 37 chemical reactions for ozone formation and loss. The photolysis rates for Atlanta come from http://cprm.acd.ucar.edu/Models/TUV/Interactive_TUV/. Other reaction rates come from IUPAC : http://www.iupac-kinetic.ch.cam.ac.uk/ (John H. Seinfeld et al.,1998) Atmospheric chemistry and physics The unit of photolysis rate : min-1 The unit of other reaction rates : ppm-1min-1. The initial concentration for NOx :0.01ppm~ 0.2ppm The initial concentration for VOCs :0~2ppmC. CH4 concentration : 1.7ppm CO concentration : 0.3ppm. The Integration Tolerance : 10-8. The reaction time for every cases changes from 5000~106mins.
Atlanta (ppm) NOx limited region VOCs limited region
Oxides of Nitrigen concentration in Atlanta (fulton county) Year Hours measured 1st Max (ppm) Annual Arithmetic Mean (ppm) 2003 8483 0.626 0.0336 2004 8407 0.795 0.0329 2005 8179 0.693 0.0329 NOx concentration in Atlanta 2003~2005 Cited from Georiga Department of Natural Resources Ambient Monitoring Program 2003~2005 annual reports
VOCs concentration in Atlanta from 2003 to 2005 VOCs concentration: 2003: ~95ppb 2004:~110ppb 2005:~165ppb Isoprene is by far the largest contributor to ozone formation at every site. VOCs(ppmc)=VOCs(ppm) * 5( for isoprene) Georiga Department of Natural Resources Ambient Monitoring Program 2005 report
Atlanta (ppm) NOx limited region VOCs limited region
Compare modeling ozone concentration to the measurement Cited from Georiga Department of Natural Resources Ambient Monitoring Program 2005 annual report
Ozone concentration control in Atlanta Ozone control in Atlanta is in the NOx limited region. Peak ozone concentration can be reduced to from about 0.09ppm to 0.08ppm by decrease NOx concentration from 0.03ppm to 0.02ppm. Peak ozone concentrations depend on different NOx levels with VOCs in 0.8ppmC
Conclusion • 1.The modeling result of peak ozone isopleths plot of Atlanta makes • sense for ozone production is suppressed by the relationship between • VOCs and NOx concentrations indicated in the chemical mechanism. • 2. According to the modeling result and the measurement of NOx, • VOCs concentration in Atlanta, ozone control in Atlanta is in the NOx- • limited region . • 3. There are also some uncertainties in the modeling and result. • Software • Modeling: only consider chemical process • Measurement of NOx, VOCs and photolysis rates • (4) Detail VOCs compounds in Atlanta