Download
1 / 132
1.32k likes | 1.54k Views
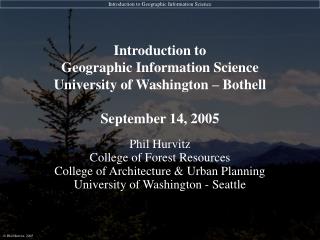
Introduction to Geographic Information Science University of Washington – Bothell September 14, 2005. Phil Hurvitz College of Forest Resources College of Architecture & Urban Planning University of Washington - Seattle. Overview. Today will be a cursory overview of GIS technology.

E N D
Introduction to Geographic Information ScienceUniversity of Washington – BothellSeptember 14, 2005 Phil HurvitzCollege of Forest ResourcesCollege of Architecture & Urban PlanningUniversity of Washington - Seattle
Overview • Today will be a cursory overview of GIS technology. • By the end of the day, students will: • be able to define GIS • understand the basic building blocks of the technology • understand how GIS is applied in many different settings • have obtained some hands-on experience using current software and real-world data sets • know where to look for GIS data • understand a basic set of GIS analytical functions
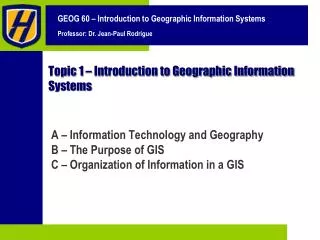
Introduction to GIS • Overview • Why use a GIS? • What can a GIS do? • How does a GIS work? • GIS definitions_
Introduction to GIS • Overview • Why use a GIS? • What can a GIS do? • How does a GIS work? • GIS definitions_
Why use a GIS? • An extension of the paper map, but much more than a map, as you will see • GIS uses the analytical power of the computer to complete complex tasks • Computer's storage power to manage large data sets. • Integration of many different types of data from many different sources • GIS maps a variety of different data to the same coordinate space (allows for combination of data)_
Why use a GIS? • Digital media are more stable than paper media, and easier to distribute via the Internet • Faster and easier update • Creation and use of "one-time" maps • Tailor-made maps • Elimination of some user bias (identical systematic routines, machine calculations) • GIS brings new tools for thinking differently about the properties of objects in space._
Introduction Overview • Why use a GIS? • What can a GIS do? • How does a GIS work? • GIS definitions_
What can a GIS do? • Generically • Find features with known properties but unknown location (“Where is a particular feature on the landscape?”)(“Where are features with specific properties?”) • Identify properties of features with known location(“What type of features are at a specific location?”) • Analyze the relationship between/among features and location(“Is there a reason these features are found at this location?”)_
What can a GIS do? • Specifically • Estimate economic effects of land-use regulation(Spotted owl, salmon) • Determine the optimal locations of new businesses(demographics, transportation) • Generate optimal routing and scheduling delivery and repair services(network & routing) • Determine the ground area covered by a new cellular phone network(visibility and line-of-sight analysis)_
What can a GIS do? • Specifically • Delineate watershed boundaries for estimates of sedimentation effects on fish-bearing streams • Predict vegetation types based on elevation, slope, and aspect • Predict landslide hazard for forest harvest units • Calculate the correlation between demographics and HIV infection rates • Locate natural areas that need protection • Make communicative, colorful, and interesting maps_
query criteria are defined location is shown Examples of what a GIS can do Example 1: Where is a given feature or set of features? “Where are forest stands greater than 100 years of age?”
1st step: select road Examples of what a GIS can do • Example 2: What features are at a given location? “What is the age of the forest near the 1050 Road?”
2nd step: select adjacent stands Examples of what a GIS can do • Example 2: What features are at a given location? “What is the age of the forest near the 1050 Road?”
3rd step: examine records of adjacent stands Examples of what a GIS can do • Example 2: What features are at a given location? “What is the age of the forest near the 1050 Road?”
Examples of what a GIS can do • Example 3: Where are areas that meet a given complex set of criteria? “What parts of the forest are located: • within 100 ft of a stream, • beyond 50 ft from a road, • on greater than 30% slope?”
Examples of what a GIS can do • closer than 100 ft to a stream, and • farther than 50 ft from a road, • on > 30% slope?
Examples of what a GIS can do • closer than 100 ft to a stream, and • farther than 50 ft from a road, • on > 30% slope?
essentially a calculus problem approximated quantitatively Examples of what a GIS can do • Example 4: How can GIS calculate distance of features? “How far away is a bird nest from the rest of the patch of nesting habitat?”
Examples of what a GIS can do • Example 5: How can data to support watershed analysis be generated within a GIS? “What are the road and stream densities (mi / sq. mi) for the forest area?”
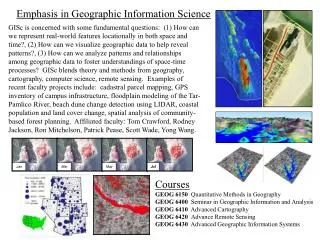
Examples of GIS generated maps detailedtopographic maps
Examples of GIS maps orthophoto image maps good for validating other data
Examples of GIS maps surface drapes & 3-D modeling
Examples of GIS maps classified (thematic) maps good for understanding data with many unique values
Examples of GIS maps documentation of research
Introduction Overview • Why use a GIS? • What can a GIS do? • How does a GIS work? • GIS definitions_
coordinate data each feature hasa record tabular data How does GIS work? Combination of and
Introduction Overview • Why use a GIS? • What can a GIS do? • How does a GIS work? • GIS definitions_
GIS definitions "A system of hardware, software, and procedures designed to support the capture, management, manipulation, analysis, modeling and display of spatially-referenced data for solving complex planning and management problems."
hardware, • software, • data, • people, and • methods GIS definitions A working GIS integrates five key components:
GIS definitions What is the difference between GISystems and GIScience? GISystems refer to the classic GIS definition • technology to support geospatial analysis in a computing framework • think “tools,” “technology,” and “technicians,” GIScience refers to the use of GIS to support scientific understanding and approaches • think “approaches,” “theory, “science,” and “scientists” The distinction is not clear-cut
GIS Skill Set • Skills necessary to succeed in GIS: • Computing proficiency • Use of file system • Knowledge of various applicatons • Programming is a big plus • Basic mathematics • Algebra, geometry, trigonometry • Ability to work independently (i.e., reading documentation) • Spatial cognition & imagination (think organic chemistry)
Introduction to GIS • Questions?
GIS Fundamentals • Overview • Spatial (coordinate) data model • Relational (tabular) data model • Scale issues • Projections & coordinate systems • Course exercise/sample data_
GIS Fundamentals • Overview • Spatial (coordinate) data model • Relational (tabular) data model • Scale issues • Projections & coordinate systems • Course exercise/sample data_
Spatial Data Model: Basic Data Types • GISystems are driven by spatial data • 2 basic spatial (coordinate/geometric) data models exist • vector: based on geometry of • points • lines • polygons • raster: based on geometry of • grid cells (images, bitmaps, DEMs)_
airports are point features each point is stored as a coordinate pair Vector Data Model Points: represent discrete point features each point locationhas a record in thetable
roads are linear features Vector Data Model Lines: represent linear features each road segmenthas a record in thetable
node node vertex vertex vertex vertex Vector Data Model Lines: fundamental spatial data model • Lines start and end at nodes • line #1 goes from node #2 to node #1 • Vertices determine shape of line • Nodes and vertices are stored as coordinate pairs_
landforms and water are polygonal features Vector Data Model Polygons: represent bounded areas each bounded polygonhas a record in thetable
Vector Data Model Polygons: fundamental spatial data model • Polygon #2 is bounded by lines 1 & 2 • Line 2 has polygon 1 on left and polygon 2 on right_
Vector Data Model Polygons: fundamental spatial data model • complex data model, especially for larger data sets • “arc-node topology,” used for ArcInfo data sets or defined by rules in the Geodatabase_
Vector Data Model • Major types (formats) of vector data available in ArcGIS • ESRI GeoDatabases • ESRI shapefiles • ArcInfo coverages and libraries • CAD files (AutoCAD DWG, DXF;Microstation DGN) • StreetMap files • Spatial Database Engine (SDE) data • ASCII point coordinate data • Linear measure (route) data_
Vector Data Model • ESRI Geodatabases • 1º preferred vector format in ArcGIS • Display very quickly • Fully editable (coordinate and tabular) in ArcGIS • Stored in RDBMS (MS Access on PC = “personal geodatabase”; industrial-strength DB for ArcSDE = “SDE geodatabase”) • Convenient storage format • Geodatabase can store many files from many source formats • Data sets are either point or line or polygon_
Vector Data Model • ESRI shapefiles • 2º preferred vector format in ArcGIS • Display quickly • Fully editable (coordinate and tabular) in ArcGIS • Simple in structure • Do not use arc-node topology • “Connected” lines do not necessarily share a common node • Adjacent polygons do not share common bounding arcs • Data sets are either point or line or polygon_
Vector Data Model Shapefile & geodatabase polygon spatial data model • less complex data model • polygons do not share bounding lines
Vector Data Model • ArcInfo coverages • Commonly found format (due to ArcInfo market dominance) • Data model more complex • Display more slowly in ArcGIS • Coordinate data not editable in ArcGIS • Polymorphic (point/line/polygon/route/annotation/…) • Problematic OS file structure (more on this later in the term)_
Vector Data Model ArcInfo coverage spatial data model • polygons share bounding lines • same topological rules can be built into Geodatabase