Download
1 / 8
80 likes | 85 Views
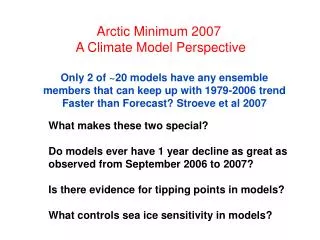
WORKSHOP : LESSONS FROM THE 2007 ICE MINIMUM. Atmospheric temperature and modes-of- variability 2000-07 and earlier analogs. WWW.BJERKNES.UIB.NO. WORKSHOP : LESSONS FROM THE 2007 ICE MINIMUM. Emerging Arctic Amplification as Seen in the NCEP/NCAR Reanalysis

E N D
WORKSHOP: LESSONS FROM THE 2007 ICE MINIMUM Atmospheric temperature and modes-of- variability 2000-07 and earlier analogs WWW.BJERKNES.UIB.NO
WORKSHOP: LESSONS FROM THE 2007 ICE MINIMUM Emerging Arctic Amplification as Seen in the NCEP/NCAR Reanalysis Mark C. Serreze, Andrew P. Barrett, Julienne Stroeve, David N. Kindig National Snow and Ice Data Center, Cooperative Institute for Research in Environmental Sciences University of Colorado, Boulder, CO Marika M. Holland National Center for Atmospheric Research Boulder CO Rises in surface and lower troposphere air temperatures through the 21st century are projected to be especially pronounced over the Arctic Ocean during the cold season. This Arctic amplification reflects loss of the sea ice cover, allowing for strong heat transfers from the ocean to the atmosphere. Consistent with observed reductions in sea ice extent, fields from the NCEP/NCAR reanalysis suggest emergence of Arctic amplification in the last decade during the autumn season.
WORKSHOP: LESSONS FROM THE 2007 ICE MINIMUM Figure 1: Anomalies by year (x axis) and month (y axis) from 1979-2007 of: (a) sea ice extent; b) 2-m (surface air) temperatures, both from the NCEP reanalysis. Results are for a specified Arctic Ocean domain/
WORKSHOP: LESSONS FROM THE 2007 ICE MINIMUM Figure 2. Latitude by height (hPa) cross sections of autumn (September through November) temperatures anomalies, relative to 1979-2007 means: a) 1993-1997'; b) 1998-2002; c) 2003-2007.
WORKSHOP: LESSONS FROM THE 2007 ICE MINIMUM Arctic SAT modes of variability, 20th century winter EOF1 EOF3 EOF2 PNA-related No known teleconnection NAO-related
WORKSHOP: LESSONS FROM THE 2007 ICE MINIMUM Figure. (a) Winter (DJF) SAT anomalies (deg C) 2000-06, (b) EOF3 wintertime modified after Semenov and Bengtsson [2003]. Arctic SAT modes of variability, recent warmth and early 20th century warmth
WORKSHOP: LESSONS FROM THE 2007 ICE MINIMUM AMO imprint on high-latitude SAT SAT PC3 40–80°N (NCEP) SAT PC3 40–80°N (AARI) SST anomalies 40–60°N Fig. North Atlantic SSTs and high-latitude SAT patterns.
WORKSHOP: LESSONS FROM THE 2007 ICE MINIMUM Atmospheric temperature and modes-of- variability 2000-07 and earlier analogs Recent warming: TATM anomalies, winter onset season (Oct-Dec) • Arctic amplification emerging strongly • SAT increase linked to sea ice decrease • Arctic warming driven from the “bottom up” Recent winter warming patterns similar to early 20th century warming, superposed on a background of recent general warming at high latitudes • SAT patterns linked to sea-ice decreases • Temporal evolution nearly identical to Atlantic Multidecadal Oscillation (AMO) time series WWW.BJERKNES.UIB.NO