Download
1 / 55
550 likes | 769 Views
The Health Roundtable. New Zealand. Presentations Lessons Learnt Workshop May 4-5, 2004 - Sydney. 1. Index of Presentations. Improving Hospital Effectiveness. Index of Stream 4a Presentations with Quick Links Workshop Aims and Honour Code Session 4a. Implementing a balanced scorecard.

E N D
The Health Roundtable New Zealand PresentationsLessons Learnt WorkshopMay 4-5, 2004 - Sydney
1. Index of Presentations Improving Hospital Effectiveness • Index of Stream 4a Presentations with Quick Links • Workshop Aims and Honour Code • Session 4a. Implementing a balanced scorecard If you view this document as a “Slide Show”, clicking on the hyperlinked text (the turquoise and underlined text) will take you to that particular page in the report
2. Persuasion 3. Decision 3. Decision 2. Workshop Aim AIM: SHARE INNOVATIONS TO IMPROVE HEALTHCARE Looking for differences! How to speed up action? 1.Knowledge 5. Confirmation The Roundtable Process 4. Implementation
2. HRT Honour Code • All those who participated in the workshop and who have received this set of slides agreed to be governed by the following HRT Honour Code • No participant shall criticise the performance of other member hospitals, or use any of the information to the detriment of a fellow member. • No external distribution of data or conclusions based on Health Roundtable workshops or data is made without the consent of each person contributing materials.
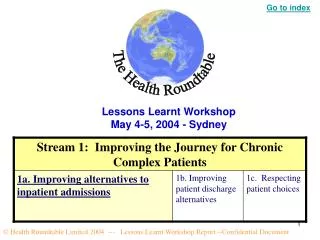
Session 4a Topic: Implementing a balanced Scorecard Systems to Maximise the Utilisation of KPI DataPresenter: Bob McDonaldHospital: Hunter Area Health Service (John Hunter Hospital) 4-5 May 2004Sydney
Problem 1: A Critical Gap Between the Operational and Strategic (2001) Vision Mission Strategy GAP! What We Measure Learning and Feedback Team/Personal Alignment and Focus
We had a number of KPIs …. but …..a focus on the things that were easy to measure, already collected • A number of critical questions we (staff, management) could not answer: • Are there critical areas that we are not focusing on because we are not measuring them • Are improvements in one area negatively impacting on another (eg department or measure)? • Are we using our resources in the best possible way? • How do we ensure the ‘loop’ is closed for performance improvement? Problem 2: Our Performance Measurement Framework was Narrow and Patchy
Solution: Implementation of the Balanced Scorecard as our Core Performance Measurement and Management Tool Vision Mission Strategy BALANCED SCORECARD What We Measure Learning and Feedback Team/Personal Alignment and Focus
The Balanced Scorecard is a dashboard set of indicators arranged under the Kaplan and Norton Balanced Scorecard headings - Customer, Internal Processes, Finance, Learning and Growth What is the Balanced Scorecard? No!
The Balanced Scorecard is a management system that enables organizations to clarify and translate their vision and strategy into action. It provides feedback around key performance drivers and outcomes in order to continuously improve strategic performance and results.
Balanced Scorecard Corporate/Strategic Planning Business Planning Resource Allocation Communication about Priorities Individual Work Plans and Perf Reviews Learning and Feedback Monthly Reporting Annual Reporting
Convert your Mission/Vision into something meaningful and achievable • Help you better manage our services and measure our success across all the critical areas • Help you focus on the really important things • Communicatewhere you are going and how you are going The Balanced Scorecard is used to:
It is one of the best (if not the best) systems to maximise the utilisation of KPI data
Three main components to a Balanced Scorecard: Strategy Map – one page visual summary of what is important and why it is important Balanced Scorecard Plan - includes measures, strategic and annual initiatives, targets, responsibilities and timeframes Balanced Scorecard Results - includes measures, stretch targets and actual monthly and annual performance
HOW WE DID IT • Project Started: 2001 • Project Support: CEO / Area Executive • Resources Required: First 18 months – no additional (except for overseas visit for Project Manager). Currently 1 FTE Project Officer. • Rollout: Plan to cascade to all clinical care and support services across the organisation (~150)
OUTCOMES SO FAR • 50 Balanced Scorecards have been developed • We are now measuring and reporting things not previously reported (50% of the measures are new) eg: • Clinical audit and peer review score • %Potentially preventable adverse events • %At-risk (eg smoking) patients targeted for risk reduction • VMO satisfaction • GP satisfaction • Patient satisfaction with staff communication • #Medical vacancies > 90 days • Information management score • Management competency score (example following)
OUTCOMES SO FAR (continued) • The Balanced Scorecard has given us an excellent framework to ensure that we are measuring the right things: • The critical KPIs that help us know whether we are on track with our strategy • Performance drivers as well as outcomes • As a result we now have a global view of the organisation and can see where we need to be focusing our attention (following)
Sample of Some Balanced Scorecard Summary Results (2002/03) Community and Patients • Improved population health • Better access • Quality health service experience Partnerships • Doctor satisfaction Integration and Internal Processes • Integrated service delivery systems • Patient care, outcomes and safety • Communicate effectively with patients/carers Financial Accountability • Prioritise and optimise resource utilisation • Meet activity targets within budget People, Learning and Innovation • Build management capabilities • Improve staff motivation and safety • Develop culture of service and teamwork • Manage information effectively
Balanced Scorecard and Perfecting Healthcare Delivery • One-year after commencing the deployment of the Balanced Scorecard, we started a major reform program – PHD (Perfecting Healthcare Delivery) …redesigning the system so that it is centred on the patient and works for patients / their carers and staff. • For each project, following diagnostic, solution and redesign phases, a suite of KPIs is developed – critical to monitor the effectiveness of the solutions • The two projects combined so one reporting and monitoring system (synergy)
Some Outcomes: Emergency Department Solutions implementation
LESSONS LEARNT (1) • Has to be senior management support from day one • The KPI report should be a focus of management meetings • Develop escalation criteria and proforma to focus the discussion on the critical issues. This should include: • Issues and identification of performance drivers • Actions (current and future) to address issues • Expected short and medium term outcomes • Clear accountabilities • Formal follow-up • Results need to be highlyvisible to everyone in the unit / hospital eg on the intranet, on a ward notice board – not just for management
LESSONS LEARNT (2) • If a large hospital / organisation, need systems to automatically extract and report the KPIs – staff do not have time! We are currently implementing SAS BSC software. • Need a system that not only show the high level KPIs but web-based interactive tools that allow staff to explore and gain understanding of performance drivers. These may be other associated KPIs (ie on the Balanced Scorecard) or more detailed underlying information. • Two examples: • Within Balanced Scorecard • Underlying information
Within BSC: Develop a Culture of Service and Teamwork Community and Patients Better access Quality health service experience Improved population health Financial Accountability Internal Processes Improve patient care, outcomes and safety Develop effective internal service integration Prioritise and optimise resource utilisation Communicate effectively with patients & their carers Improve staff motivation and safety Develop a culture of service and teamwork People, Learning and Innovation
Session 4aTopic: Improving Hospital Effectiveness Implementing a Balanced ScorecardPresenter: Mary-Jane WhiteHospital: St Vincent’s Melbourne 4-5 May 2004Sydney
KEY PROBLEMS • Systems of clinical governance for the Board and the Executive needed improvement • Understanding of key performance areas by members of the Board was limited
INNOVATIONS IMPLEMENTED • Development of a suite of key performance indicators (scorecard) to monitor health service performance • Refinement of possible list of indicators to provide a quick snapshot of performance that is easy to understand • Establish links between relevant information systems for accurate and timely data
INNOVATIONS IMPLEMENTED • Users Manual developed with definitions for all indicators and how these are collected • Use of standard format protocols eg. financial year, actuals, targets, previous years average, cell notes, commentary • Accessible by intranet and shared drive • One page summaries for Board & CAC
HOW WE DID IT • Project Started: late 2002 • Project Champion: Director Strategy & Quality • Team Composition:Quality & Risk Unit, Executive reps, HIM’s, Data Manager • Resources Required: Expertise of team, robust IT networks and systems • Special Funding: Nil
OUTCOMES SO FAR • Scorecard has been successfully used for reporting to:Australian Council on Healthcare Standards,Victorian Department of Human Services and other peak bodies, for the Board, the Community Advisory Committee, Executive, Directorates and Quality Councils • SVH Scorecard has been the ‘flagship’ for rolling out Directorate and local scorecards, all of which will be linked by end of 2004
OUTCOMES SO FAR • Satisfaction rates for Board, Executive, CAC with the quality of information they receive regarding organisational performance • 2002 = 70% satisfaction following interview • 2004 = 80% satisfaction following interview • “…the community rightly expects that the safety and quality of the health care system will be monitored and publicy reported”. Australian Council for Safety & Quality in Health Care, 2003
OUTCOMES SO FAR “The new scorecard and graphs enable us to clearly see at a glance how we are performing…” Board Member “I really like the way the one page scorecard graphs have been presented, they are written in plain English and the commentary quickly alerts me to any major issues I need to be aware of…” CAC Member
LESSONS LEARNT • Key success factors: • Extensive consultation & collaboration with key stakeholders • Leadership & commitment from clinical champions • Effective feedback loop • Lessons: important to involve consumers more actively in the early planning phase of the project.
“…the community rightly expects that the safety and quality of the health care system will be monitored and publicy reported”.Australian Council for Safety & Quality in Health Care, 2003
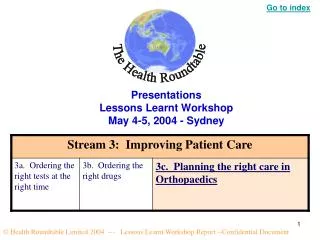
Session 4aTopic: Implementing a Balanced Scorecard Use of Scorecard in Linking Hospital Services with BudgetPresenter: Michael KalimniosHospital: Royal Brisbane & Womens 4-5 May 2004Sydney
KEY PROBLEMS • Significant budget overrun • No planned service development • No linking of services with budget • Mutually exclusive focus • Budget • Service delivery
INNOVATIONS IMPLEMENTED • Implemented a Hospital wide Scorecard approach • Initially expanded standard 4 perspectives to 7 to suit Hospital • All Divisions reported against key initiatives and KPIs against each perspective • Std initiatives across hospital – mandatory
INNOVATIONS IMPLEMENTED • Divisions able to develop own local initiatives • Initiatives able to rolled up into Hospital wide scorecard • Attempt to link initiatives • Monthly reporting at Executive level against Scorecard
HOW WE DID IT • Project Started: 2000/01 • Project Champion: CEO • Team Composition: DoF, DCD, EDMS, D DOM • Resources Required: Mgr Planning engaged to oversee process – Divisional roles linked to existing positions eg Business Managers built into existing role • Special Funding: nil
OUTCOMES SO FAR • Scorecard basis for all reporting and planning • Budget objectives directly linked to Consumer, Quality/Process and Workforce objectives • Budget integrity achieved in 200405 – 1st time in memory • Still need to re focus fiscal management and link better to Service development
LESSONS LEARNT • Need to start slowly and refine • Now streamlined – 4 perspectives, reporting • Don’t be too theoretical • Sometimes need to be directive to achieve outcomes • Be true to the process – make it meaningful • What we would do differently • Better define mandatory requirements • Emphasis links between perspectives better • More rigor in in linking service delivery into Scorecard process
Session 4a Topic: Implementing a Balanced Scorecard Implementing Enterprise Performance PlaningHealth Performance ManagementCorVuPresenter: Damian Stevens-Jones Jon F Mortensen “Driving Breakthrough Performance” 4-5 May 2004, Sydney
Implementing Enterprise Performance Management Health Performance Management From KPI Alignment to Strategic Management “Driving Breakthrough Performance” Damian Stevens-Jones Jon F Mortensen
KEY PROBLEMS • Limited visualisation of performance across all levels of NSW Health • No holistic view of initiatives and their progress across AHSs, Hospitals or Wards • There is limited communication of Strategic Objectives • No readily visible alignment between initiatives, individual activities and financial outcomes • Often no readily identifiable individual traceability, nor accountability, for performance outcomes and initiatives • Lack of visible constructive collaborative effort to provide much needed continuous improvement • Workflow incorporating escalations, notifications, alerts and exceptions often manual rather than automated
Vision Better health: from the Harbour to the Hawkesbury Commitments Communities, Services, Systems, People, Infrastructure, Environment Objectives Measures Targets Strategies Sub-Strategies Efficiency Bed occupancy rate 84% (IV 82%) Avg length of stay 5.5 days (IV 6) Separations 8,484 (IV 8,000) 3.2 Design & - Identify Target Areas - May implement efficient - Process Improvement- Jun patient care processes - Improve org.skills - Aug Performance Measurement Performance Management Feedback and Communication The Innovation Themes