Download
1 / 37
380 likes | 448 Views
Proposal for a self-calibrating and instrument-independent MOS DRS. Carlo Izzo. MOS arc lamp exposure: FORS2-MXU, GRIS_150I+27. Using first-guess models to find reference lines…. Earthquake!. High Expectations.

E N D
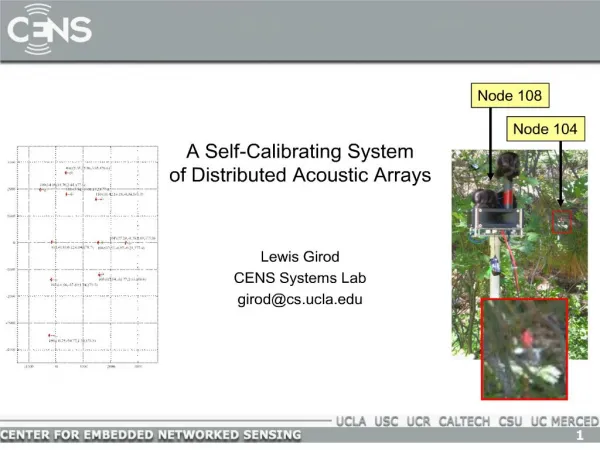
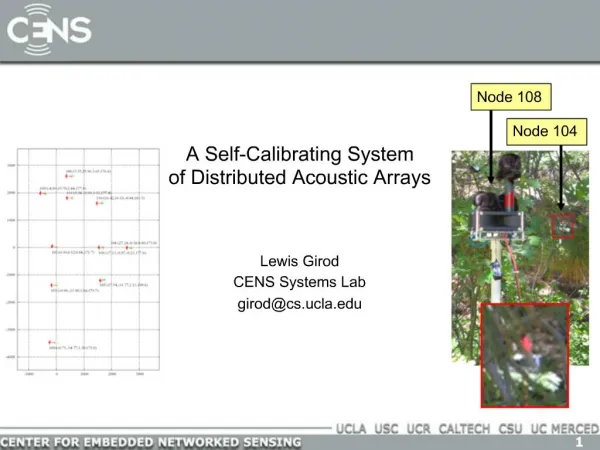
Proposal for a self-calibrating and instrument-independent MOS DRS Carlo Izzo
High Expectations Traditional data reduction techniques are based on first-guess distortion models. • The instrument is stable, together with its components (grisms, masks, filter wheels, etc.) • The code can be kept simple, because the reference patterns in the calibration exposures (flats, arcs) are safely identified • The procedures will be general, because different distortion models can be stored in appropriate configuration files
The hard reality • The instrument is not stable, changing in the short and long time scales, requiring continuous maintenance work on the configuration files • The code cannot be kept simple, because the reference patterns are not safely identified (e.g., due to unexpected contaminations, or to instrument instabilities) • The procedures cannot be kept general, because the ad hoc solutions adding robustness to the DRS are typically instrument-dependent
Using first-guess model… The pipeline may stop with a generic“calibration failed” The pipeline may find a wrong solution The QC1 parameters may show nothing strange Using pattern-recognition… The pipeline always completes successfully The pipeline always finds the right solution The QC1 parameters report exactly what happened … but what’s the use of it?
Do we need a physical model of the distortions? YES! A physical model of the optical distortions is necessary for comparing the expected distortions with the observed ones (instrument health monitoring) BUT:We should not use the model of the expected distortions as a first-guess (even if we may use it for fitting the data) ALSO: A physicalmodel of the instrument distortions is necessary for a meaningful instrument health monitoring
Fix the models, or fix the instrument? • In principle, the instrument should be fixed. • In practice, it is often necessary to fix the models because: • To fix the instrument is not always immediate (see for instance the light contaminations in FORS, or the flexures in VIMOS), and in the meantime we must keep reducing the data • Sometimes the real optical distortions are “accepted”, even if they are far from the instrument original design Using a pattern-recognition approach we would not need to fix models anymore!
The pattern: wavelengths … 5400.562 5460.742 5764.419 5769.598 5790.656 5852.488 5875.620 5881.900 5944.830 … The data: pixel positions … 1220.64 1253.23 1299.44 1304.07 1339.30 1400.33 1450.28 1457.32 1471.00 1496.21 1520.66 1522.44 1549.01 … Looking for patterns
Looking for peaks ________________________________________
Looking for peaks • Any local maximum identifies a peak • A peak positions is determined by parabolic interpolation of the three nearby pixel values
A simple case: FORS2-LSS GRIS_1200R _ _ _ _ _ _ _ _ _ _ _ _ _ _ _ _ _ _ _ _ _ _ _ _ _ _ _
Wavelength calibration Mean accuracy: 0.05 pixel
Resampled spectrum Mean accuracy: 0.05 pixel
Wavelength calibration Mean accuracy: 0.07 pixel
Wavelength calibration Mean accuracy: 0.09 pixel
Wavelength calibration Mean accuracy: 0.05 pixel
Identifying the slits Select the reference wavelength: in this example,l= 7000.00
Accuracy The accuracy of the extraction mask depends on many factors: • Number of fitted points, • Accuracy of peaks positions, • Appropriate choice of fitting models, • Position along the spectral interval, … but, above all, • Correct identification of the detected peaks. Inaccuracy comes from misidentification!
This system is flexible • Any MOS arc lamp exposure can be wavelength calibrated (instrument-independency) • This method can also be directly applied to the scientific exposures (if the sky is visible and there are enough sky lines) • This method may even be applied to intermediate products from any kind of spectroscopic data (not just MOS, but also IFU, echelle, etc.).
GIRAFFE Medusa1_H525.8nm Mean accuracy: 0.10 pixel
Other issues After the extraction mask is completely defined, the usual reduction steps can be applied: • Object detection, • Determination of the sky spectrum, • Optimal extraction, • Combining different spectra, • Error propagation