Download
1 / 7
70 likes | 251 Views
American multinational pharmaceutical corporation founded in 1849 Core business: production and development of medicines and vaccines in many areas such as immunology , oncology, inflammation etc . 2009-2009: growth by mergers including those with Warner-Lambert, Pharmacia and Wyeth

E N D
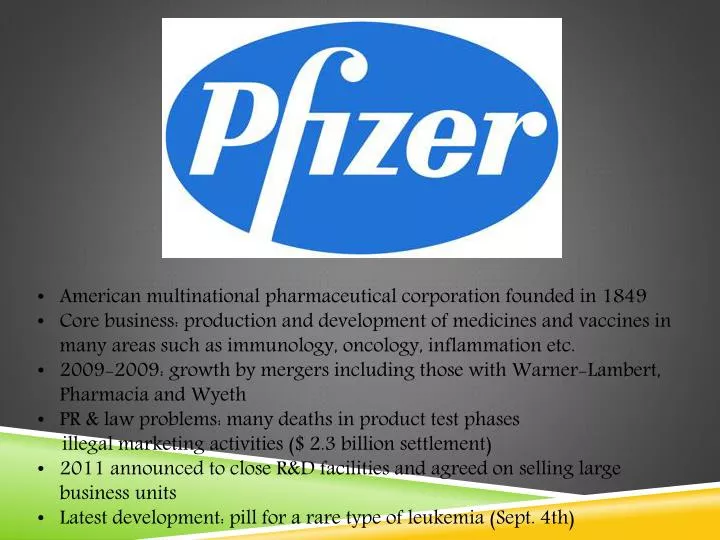
American multinational pharmaceutical corporation founded in 1849 • Core business: production and development of medicines and vaccines in many areas such as immunology, oncology, inflammation etc. • 2009-2009: growth by mergers including those with Warner-Lambert, Pharmacia and Wyeth • PR & law problems: many deaths in product test phases • illegal marketing activities ($ 2.3 billion settlement) • 2011 announced to close R&D facilities and agreed on selling large business units • Latest development: pill for a rare type of leukemia (Sept. 4th)
Inventory turnover Inventory Turnover = Cost of Goods Sold/Inventory 201120102009 15,085,000 15,838,000 8,459,000 / / / 7,769,000 8,275,000 12,403,000 = = = 1.941.910.68
Debt Ratio Debt Ratio = Total Assets/Total Liabilities 201120102009 195,014,000 188,002,000 212,949,000 / / / 105,812,000 107,201,000 122,935,000 = = = 1.84301.75371.7322
Current Ratio Current Ratio = Total Current Assets/ Total Current Liabilities 201120102009 57,728,000 61,013,000 61,670,000 / / / 28,069,000 28,636,000 37,225,000 = = = 2.05662.13061.6567
Quick ratio Quick Ratio = Current Assets – Inventories/ Current Liabilities 201120102009 57,728,000-7,769,000 61,013,000-8,275,000 61,670,000-12,403,000 / / / 28,069,000 28,636,000 37,225,000 = = = 1.771.841.32
Total assets turnover Total Assets Turnover = Sales/Total Assets 201120102009 60,109,000 59,494,000 53,213,000 / / / 188,002,000 195,014,000 212,949,000 = = = 0.3190.3510.249
In conclusion, you can see the chart for 2009-2011 shows the five different ratios that we selected. The chart depicts that 3/5 of the ratios have increased over the last three years. We conclude that the reason for this may be due to the increased activity in our economy since the financial down fall that occurred in 2007.