Download
1 / 1
10 likes | 70 Views
FUV 150 NUV 300 I 814 H 160. FUV 150 NUV 300 I 814 H 160. 0.199 0.321 0.321 0.485 0.561 0.753. 0.090 0.321 0.321 0.475 0.555 0.682.

E N D
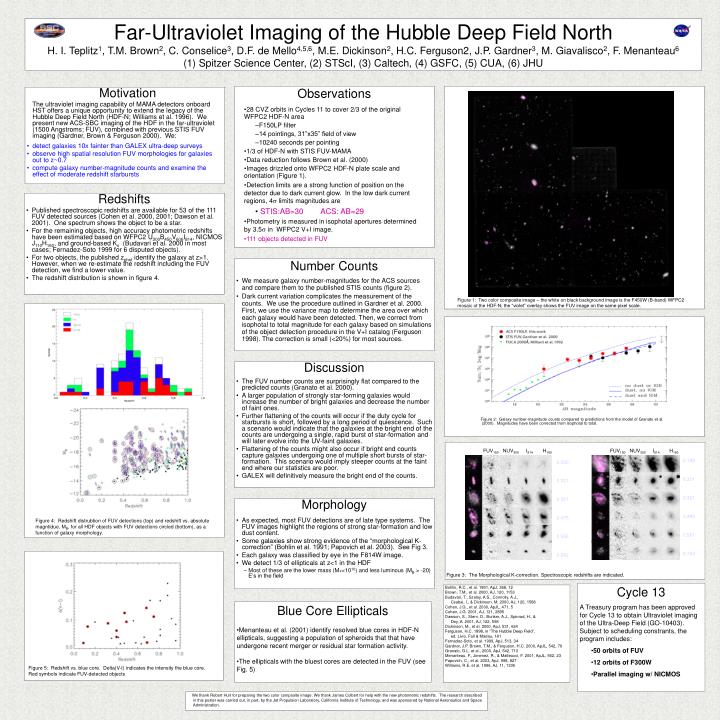
FUV150 NUV300 I814 H160 FUV150 NUV300 I814 H160 0.199 0.321 0.321 0.485 0.561 0.753 0.090 0.321 0.321 0.475 0.555 0.682 Figure 2: Galaxy number-magnitude counts compared to predictions from the model of Granato et al. (2000). Magnitudes have been corrected from isophotal to total. Figure 3: The Morphological K-correction. Spectroscopic redshifts are indicated. Far-Ultraviolet Imaging of the Hubble Deep Field North H. I. Teplitz1, T.M. Brown2, C. Conselice3, D.F. de Mello4,5,6, M.E. Dickinson2, H.C. Ferguson2, J.P. Gardner3, M. Giavalisco2, F. Menanteau6 (1) Spitzer Science Center, (2) STScI, (3) Caltech, (4) GSFC, (5) CUA, (6) JHU Observations Motivation The ultraviolet imaging capability of MAMA detectors onboard HST offers a unique opportunity to extend the legacy of the Hubble Deep Field North (HDF-N; Williams et al. 1996). We present new ACS-SBC imaging of the HDF in the far-ultraviolet (1500 Angstroms; FUV), combined with previous STIS FUV imaging (Gardner, Brown & Ferguson 2000). We: • detect galaxies 10x fainter than GALEX ultra-deep surveys • observe high spatial resolution FUV morphologies for galaxies out to z~0.7 • compute galaxy number-magnitude counts and examine the effect of moderate redshift starbursts • 28 CVZ orbits in Cycles 11 to cover 2/3 of the original WFPC2 HDF-N area • F150LP filter • 14 pointings, 31”x35” field of view • 10240 seconds per pointing • 1/3 of HDF-N with STIS FUV-MAMA • Data reduction follows Brown et al. (2000) • Images drizzled onto WFPC2 HDF-N plate scale and orientation (Figure 1). • Detection limits are a strong function of position on the detector due to dark current glow. In the low dark current regions, 4s limits magnitudes are • STIS:AB=30 ACS: AB=29 • Photometry is measured in isophotal apertures determined by 3.5s in WFPC2 V+I image. • 111 objects detected in FUV Redshifts • Published spectroscopic redshifts are available for 53 of the 111 FUV detected sources (Cohen et al. 2000, 2001; Dawson et al. 2001). One spectrum shows the object to be a star. • For the remaining objects, high accuracy photometric redshifts have been estimated based on WFPC2 U300B450V606I814, NICMOS J110H160, and ground-based Ks (Budavari et al. 2000 in most cases; Fernadez-Soto 1999 for 6 disputed objects). • For two objects, the published zphot identify the galaxy at z>1. However, when we re-estimate the redshift including the FUV detection, we find a lower value. • The redshift distribution is shown in figure 4. Number Counts • We measure galaxy number-magnitudes for the ACS sources and compare them to the published STIS counts (figure 2). • Dark current variation complicates the measurement of the counts. We use the procedure outlined in Gardner et al. 2000. First, we use the variance map to determine the area over which each galaxy would have been detected. Then, we correct from isophotal to total magnitude for each galaxy based on simulations of the object detection procedure in the V+I catalog (Ferguson 1998). The correction is small (<20%) for most sources. Figure 1: Two color composite image – the white on black background image is the F450W (B-band) WFPC2 mosaic of the HDF-N; the “violet” overlay shows the FUV image on the same pixel scale. Discussion • The FUV number counts are surprisingly flat compared to the predicted counts (Granato et al. 2000). • A larger population of strongly star-forming galaxies would increase the number of bright galaxies and decrease the number of faint ones. • Further flattening of the counts will occur if the duty cycle for starbursts is short, followed by a long period of quiescence. Such a scenario would indicate that the galaxies at the bright end of the counts are undergoing a single, rapid burst of star-formation and will later evolve into the UV-faint galaxies. • Flattening of the counts might also occur if bright end counts capture galaxies undergoing one of multiple short bursts of star-formation. This scenario would imply steeper counts at the faint end where our statistics are poor. • GALEX will definitively measure the bright end of the counts. Morphology • As expected, most FUV detections are of late type systems. The FUV images highlight the regions of strong star-formation and low dust content. • Some galaxies show strong evidence of the “morphological K-correction” (Bohlin et al. 1991; Papovich et al. 2003). See Fig 3. • Each galaxy was classified by eye in the F814W image. • We detect 1/3 of ellipticals at z<1 in the HDF • Most of these are the lower mass (M*<1010) and less luminous (MB > -20) E’s in the field Figure 4: Redshift distrubtion of FUV detections (top) and redshift vs. absolute magntidue, MB, for all HDF objects with FUV detections circled (bottom), as a function of galaxy morphology. • Cycle 13 • A Treasury program has been approved for Cycle 13 to obtain Ultraviolet imaging of the Ultra-Deep Field (GO-10403). Subject to scheduling constrants, the program includes: • 50 orbits of FUV • 12 orbits of F300W • Parallel imaging w/ NICMOS Bohlin, R.C., et al. 1991, ApJ, 368, 12 Brown, T.M., et al. 2000, AJ, 120, 1153 Budavari, T., Szalay, A.S., Connolly, A.J., Csabai, I., & Dickinson, M. 2000, AJ, 120, 1588 Cohen, J.G., et al. 2000, ApJL, 471, 5 Cohen, J.G. 2001, AJ, 121, 2895 Dawson, S., Stern, D., Bunker, A.J., Spinrad, H., & Dey, A. 2001, AJ, 122, 598 Dickinson, M., et al. 2000, ApJ, 531, 624 Ferguson, H.C. 1998, in “The Hubble Deep Field”, ed. Livio, Fall & Madau, 181 Fernadez-Soto, et al. 1999, ApJ, 513, 34 Gardner, J.P. Brown, T.M., & Ferguson, H.C. 2000, ApJL, 542, 79 Granato, G.L. et al., 2000, ApJ, 542, 710 Menanteau, F., Jimenez, R., & Matteucci, F. 2001, ApJL, 562, 23 Papovich, C., et al. 2003, ApJ, 598, 827 Williams, R.E. et al. 1996, AJ, 11, 1335 • Blue Core Ellipticals • Menanteau et al. (2001) identify resolved blue cores in HDF-N ellipticals, suggesting a population of spheroids that that have undergone recent merger or residual star formation activity. • The ellipticals with the bluest cores are detected in the FUV (see Fig. 5) Figure 5: Redshift vs. blue core. Delta(V-I) indicates the intensity the blue core. Red symbols indicate FUV-detected objects We thank Robert Hurt for preparing the two color composite image. We thank James Colbert for help with the new photometric redshifts. The research described in this poster was carried out, in part, by the Jet Propulsion Laboratory, California Institute of Technology, and was sponsored by National Aeronautics and Space Administration.