Download

1 / 18
180 likes | 264 Views
Observations. DI Water 40% Ethanol. Statement of Problem. Why does the pigment look faded with 40% ethanol?. Hypotheses. Ha1 Ethanol enters the cell and breaks down the pigment. Ha2 Ethanol breaks down the cell membrane releasing contents of the cell including the pigment.

E N D
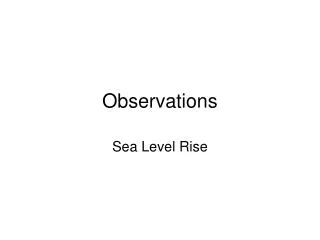
Observations • DI Water • 40% Ethanol
Statement of Problem • Why does the pigment look faded with 40% ethanol?
Hypotheses • Ha1 Ethanol enters the cell and breaks down the pigment. • Ha2 Ethanol breaks down the cell membrane releasing contents of the cell including the pigment.
Methods • Control = chopped onions added to water. • Treatment = chopped onions added to 40% ethanol. • Measure amount of pigment in two solutions with spectrometer.
Spectrometer Measures light intensity of different wavelengths (colors) Sensor
Predictions • Ha1 Ethanol enters the cell and breaks down the pigment. • Ha2 Ethanol breaks down the cell membrane releasing contents of the cell including the pigment. • If Ha1, then the control solution will have the same or more pigment than the treatment. • If Ha2, then the control solution will have less pigment than the treatment.
Measures of Central Tendency 3 4 4 5 6 7 7 7 7 8 8 Mean = (sum)/n = 66/11 = 6 Median = center value = 7 *If n is even, median = avg. of the two middle numbers ex. 1 4 4 6 9 15 median = 5
Indices Mathematical manipulations of the data to assist with interpretation Ex. Diet Studies typically record: N = numerical percentage M = mass percentage F = frequency of occurrence Index of Relative Importance = (N+M)*F Another example: Shannon Weaver’s Index of Diversity
Graphs t Continuous independent variables
Graphs Cascades frog stomach contents at fish-containing and fishless lakes Discrete independent variables Bar graphs need error bars
Graphs • X-axis is the independent variable • Y- axis is the dependent variable • Need titles or legends • Bar graphs need error bars, usually +/- SE • SE=Standard Error • Onto stats…
Statistics for this lab Procedure #2 Bar graphs need to have error bars Error bars will represent the standard error (SE) 3 4 4 5 6 7 7 7 7 8 8 Dataset A Mean = 66/11 = 6 -200 -58 -20 -15 4 7 7 40 43 70 188 Dataset B Mean = 66/11 = 6 What’s the difference? SEA = 0.52 SEB = 28.18
Standard Error SE represents the amount of variation within a sample SE = (standard deviation) / (sqrt(N)) N is the sample size Standard deviation:
T-tests & Statistical Hypotheses Ho: Treatment (alcohol) absorption = control (water) absorption. Ha: Treatment absorption ≠ control absorption. T-tests use means and standard errors to determine whether two discrete groups are significantly different.
T-tests P value Probability(type I error) Level of significance = P “Statistically significant” Type I error: rejecting a true null hypothesis Type II error: accepting a false null hypothesis Generally, scientists try to minimize the probability of making a type I error.
T-tests Ho: Treatment (alcohol) absorption = control (water) absorption. Ha: Treatment absorption ≠ control absorption. ex. if P=0.48 48% chance that we are wrong to reject Ho. Thus, we do not reject Ho. P<0.05 acceptable for most things ex. If P=0.03, we would reject Ho and accept Ha.