Download
1 / 17
170 likes | 266 Views
The nonlinear patterns of North American winter temperature and precipitation associated with ENSO. Aiming Wu, William W. Hsieh Dept. of Earth & Ocean Sciences, University of British Columbia and Amir Shabbar Meteorological Services of Canada Downsview, Ontario.

E N D
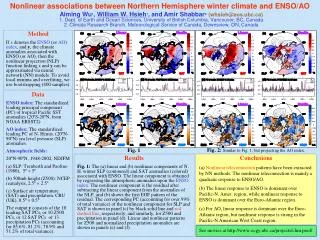
The nonlinear patterns of North American winter temperature and precipitation associated with ENSO Aiming Wu, William W. Hsieh Dept. of Earth & Ocean Sciences, University of British Columbia and Amir Shabbar Meteorological Services of Canada Downsview, Ontario
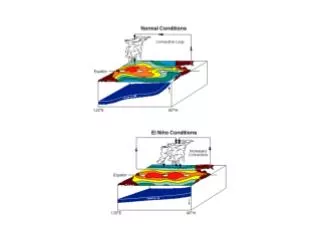
ENSO = El Niño + Southern Oscillation El Niño La Niña
Atmos. Response to ENSO is nonlinear Composite of Z500 and tropical precipitation during El Niño (A) and La Niña (B) (from Hoerling et al 1997 J. of Climate) + - A + - • La Niña El Niño • Sign reversed • Shifted eastward by 30-40°(asymmetric) + + B -
Question If x is the ENSO index, how to derive the atmos. response y = ƒ(x) ? • linear regression (or projection) y =a•x –x +x - - + + - + • Linear method cannot extract asymmetric patterns between –x and +x • Need a nonlinear method
Nonlinear projection via Neural Networks (NN projection) • x, the ENSO index • h, hidden layer • y´, output, the atmos. response A schematic diagram Cost function J = || y – y´ || is minimized to get optimal Wx, bx, Wh and bh (y is the observation)
Data ENSO index (x) • 1st principal component (PC) of the tropical Pacific SSTA • Nov.-Mar. • 1950-2001,monthly • SST data from ERSST-v2 (NOAA) • Linear detrend • standardized Atmos. Fields (y) • surface air temp. (SAT) and precip.(PRCP) • From CRU-UEA (UK) • Monthly,1950–2001, 11 • Nov.-Mar.; North America • Anomalies (1950-01 Clim) • Linear detrend • PRCP standardized • Condensed by PCA 10 SAT PCs (~90%) retained 12 PRCP PCs (~60%)
Bootstrap • A single NN model may not be stable (or robust) • Bootstrap: randomly select one winter’s data 52 times from the 52-yr data (with replacement) one bootstrap sample • Repeat 400 times train 400 NN models average of the 400 models as the final solution 400 NN models Give a x NN model y (combined with EOFs) atmosphere anomaly pattern associated with x
NN projecton in the SAT PC1-PC2-PC3 space • Green: 3-D • Blue: projected on 2-D PC plane • “C” extreme cold state; “W” extreme warm state • Straight line: linear proj. • Dots: data points
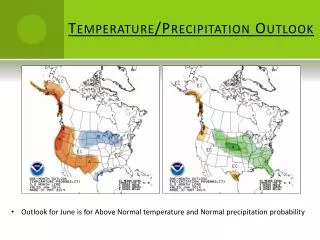
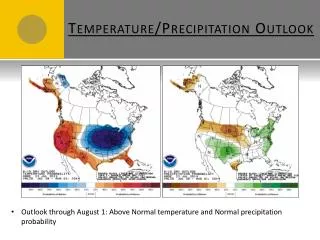
SAT anomalies • as ENSO index takes on its (a) min. (d) max. (b) 1/2 min. (e) 1/2 max. (c) a-2b (f) d-2e • Darker color above 5% significance
PCA on Lin. & Nonlin. Parts of NN projection Linear regression NL = NN – LR 27% 73%
PC1 of Lin. part vs. ENSO index a straight line • PC1 of Nonlin. part vs. ENSO index a quadratic curve A quadratic response
A polynomial fit 1, 2 are x, x2 normalized, x is the ENSO index SAT
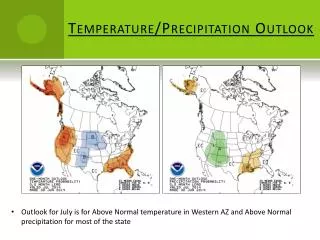
PRCP anomalies • as ENSO index takes on its (a) min. (d) max. (b) 1/2 min. (e) 1/2 max. (c) a-2b (f) d-2e • Darker color above 5% significance
Lin. & nonlin. prcp. response to ENSO LR + NL = NN 78% 22%
Summary and Conclusion • N. Amer. winter climate responds to ENSO in a nonlinear fashion (exhibited by asymmetric SAT and PRCP patterns during extreme El Niño and La Niña events). • The nonlinear response can be successfully extracted by the nonlinear projection via neural networks (NN), while linear method can not. • NN projection consists of a linear part and a nonlinear part. The nonlinear part is mainly a quadratic response to the ENSO SSTA, accounting for 1/4~1/3 as much as the variance of the linear part.