Download
1 / 18
180 likes | 271 Views
Estimating Hypermutation Rates During In Vivo Immune Responses. Steven H. Kleinstein Department of Computer Science Princeton University. Flu Antigens. B. B. B. Hypermutation & Selection. ~3 weeks. B Cell. B. B. B. B. …ATGC…. Immune System Protects Body From Pathogens.

E N D
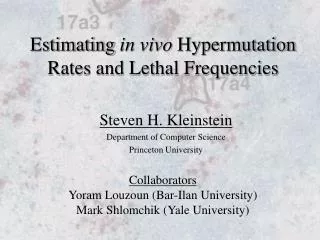
Estimating Hypermutation RatesDuring In Vivo Immune Responses Steven H. Kleinstein Department of Computer Science Princeton University
Flu Antigens B B B Hypermutation & Selection ~3 weeks B Cell B B B B …ATGC… Immune System Protects Body From Pathogens B cells bind antigens with antibody receptors Commonly Accepted: Somatic Hypermutation Restricted to Germinal Centers
Control Primary anti-hapten response to NP (Jacob et al., 1991; Jacob and Kelsoe, 1992; Jacob et al., 1993; Radmacher et al., 1998) Germinal Centers Dividing B cells FDC Motivating Experiment In auto-immune mouse model, observed mutating B cells in extra-follicular areas of spleen (not germinal centers) Auto-immune Mouse MRL/lpr AM14 heavy chain transgenic (William, Euler, Christensen, and Shlomchik. Science. 2002 ) Extra-Follicular Areas Microdissection (10 cells) B cells T cells Estimate mutation rate to show (hyper?)mutation
High Mutation Rate Low Mutation Rate Number of Mutations Observed Number of Mutations Number of Cell Divisions What’s hard about estimating the mutation rate? The number of divisions in vivo is unknown Most recognized in vivo estimates took educated guesses (McKean et al, 1984 and Sablitzky et al, 1985)
4 5(TC) 1 3 1(GA) 9(CA) 2(GC) 2 8(TG) Germline Clonal tree ‘shapes’ reflect underlying dynamics Clonal Trees Provide Needed Information Analyze pattern of shared and unique mutations among sequences from each microdissection Germline GGGATTCTC 1 -C-----G- 2 -------G- 3 A------GA 4 A---C--GA
A A A B B B C D D (Simulation Data – 5 sequences / tree) g g ct ct c D a a t t Initial Sequence Initial Sequence Relevant shape measures can differentiate similar clones Relating Tree Shapes to Underlying Dynamics Investigate with computer simulation of B cell clonal expansion Parameters: # divisions (d), mutation rate (m), lethal frequency (l), # sequences (s) Compare:Rate of 0.2 division-1 for 14 divisions Rate of 0.4 division-1 for 7 divisions
Intermediate Vertices is Useful Measure Compare: Rate of 0.2 division-1 for 14 divisions Rate of 0.4 division-1 for 7 divisions (Simulation Data) Shape measures can supplement information from mutation counting
Assumes equivalent mutation rate in all trees, although number divisions may differ Mutation Rate Experimental Observations Simulation of B cell expansion Set of Observed Tree Shapes = Distribution of Tree Shapes Number of mutations Intermediate vertices Sequences at root Also developed analytical method based on same underlying idea (The Journal of Immunology (2003) Vol. 171 No. 9, 4639-4649.) Method for Estimating Mutation Rate (m) Find mutation rate that produces distribution of tree ‘shapes’ most equivalent to observed set of trees
Run simulation many times to fill in equivalent matrix • Likelihood of experimentally observed tree t: Sample space is subset of all simulation runs • Likelihood of experimental dataset: Use Golden Section Search to optimize mutation rate (m) Details of the Simulation Method For each value of the mutation rate (m), calculate likelihood by… Equivalent Matrix, E(t,d) # simulated trees ‘equivalent’ to observed tree after d divisions # divisions (d) t
Not tolerant of noise, Make sure evaluation is precise Method is effective with 128,000 simulations per Likelihood Finding the Optimal Mutation Rate Golden Section Search works by successive bracketing of minimum/maximum http://lib-www.lanl.gov/numerical/bookcpdf/c10-1.pdf Direct Search Method (No Derivative) Simple Implementation, Linear Convergence
Master-Worker Framework Naturally parallel application easily makes use of cluster resources Master Process Parameters Results … Worker 1 Worker 2 Worker P Distribution using MPI -- ask about my code sample
Only replacement mutations can be lethal, so… Lethal Frequency (l) H …CAT… H …CAC… Y …TAT… Silent Germline DNA Sequence Experimental Data Replacement = Expected R / (R + S) Fraction of all mutations that are replacements Observed R / (R + S) Choose l so expected R/(R+S) equals observed value over all mutations Estimating the Lethal Frequency (l) Simulation Model Parameters: mutation rate (m), # divisions (d), # sequences (s), lethal frequency (l)
Method Precision (SD = 0.035 division-1) Method works even with limited number of clonal trees and sequences Validating the Simulation Method Use simulation to construct synthetic data sets with limited number of trees/sequences reflecting currently available experimental data
Generation of synthetic data Synchronous Division Asynchronous Division Assumption does not significantly impact rate estimate Testing Method Assumption… All cells in single microdissection divided same number of times (i.e., division is synchronous)
Mutation Rate in Autoimmune Response Experimental data set: 31 trees from 7 mice, 6 sequences / tree from extra-follicular areas (Williams et al, Science, 2002) Estimated l 0.55 based on R/(R+S) Estimated mutation rate is 1.0 ± 0.1 x 10⁻³ base-pair-1 division-1
Mutation Rate in Primary NP Response Experimental data set: 23 trees, 7 sequences / tree from germinal centers (Jacob et al., 1991; Jacob and Kelsoe, 1992; Jacob et al., 1993; Radmacher et al., 1998) • Testing impact on estimate: • Data based on larger picks • Positive selection may be factor Estimated mutation rate is 1.1 ± 0.1 x 10⁻³ base-pair-1 division-1
Summary • Developed simulation and analytical methods to estimate in vivo mutation rates (and lethal frequencies) • First rigorous method for in vivo estimates • Synthetic datasets used to show that… • Methods are precise (± 0.1 x 10⁻³ base-pair-1 division-1) • Major assumptions do not impact results • Distributed computing used to speed evaluation • Extra-follicular B cells in autoimmune mouse hypermutate • Mutation rate (1.0 ± 0.1 x 10⁻³) similar to NP response (1.1 ± 0.1 x 10⁻³) Rigorous method to compare mutation rates under varying experimental conditions
Acknowledgements Yoram Louzoun (Bar-Ilan University) Mark Shlomchik (Yale University) Jaswinder Pal Singh (Princeton University) PICASsoProgram in Integrative Information, Computer and Application Sciences For more information: stevenk@cs.princeton.edu; www.cs.princeton.edu/~stevenk Kleinstein, Louzoun and Shlomchik The Journal of Immunology (2003) Vol. 171 No. 9, 4639-4649.