Download
1 / 10
100 likes | 200 Views
Fig. 32 - PRODOTTO INTERNO LORDO PRO CAPITE IN PPP (*) (Indici 1980=100). (*) Milioni di dollari. Fonte: Elaborazioni CSC su dati OCSE. Fig. 33 - TASSI DI DISOCCUPAZIONE - CONFRONTI INTERNAZIONALI. Fonte: Eurostat. Fig. 34 - TASSI DI DISOCCUPAZIONE - CONFRONTI INTERNAZIONALI.

E N D
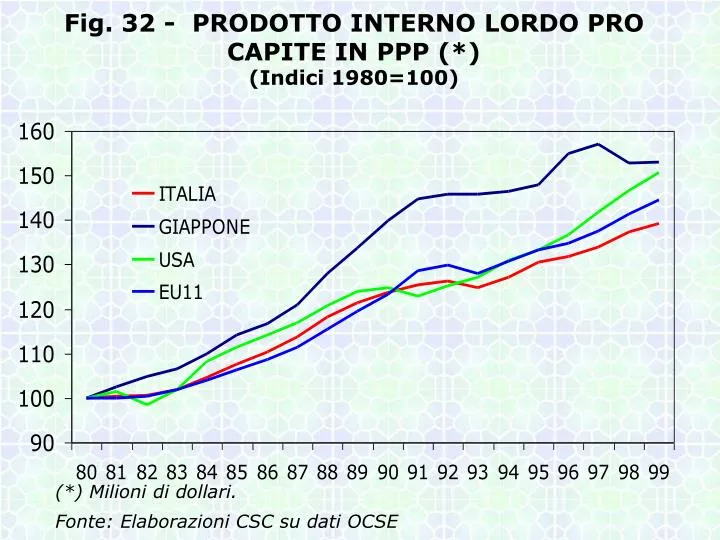
Fig. 32 - PRODOTTO INTERNO LORDO PRO CAPITE IN PPP (*)(Indici 1980=100) (*) Milioni di dollari. Fonte: Elaborazioni CSC su dati OCSE
Fig. 33 - TASSI DI DISOCCUPAZIONE - CONFRONTI INTERNAZIONALI Fonte: Eurostat
Fig. 34 - TASSI DI DISOCCUPAZIONE - CONFRONTI INTERNAZIONALI (*) Germania ovest fino al 1992. Fonte: Eurostat
Fig. 35 - DIFFERENZIALE DI INFLAZIONE AL CONSUMO TRA ITALIA E I PAESI DELL’EURO (*) (Indice armonizzato, variazioni % tendenziali) (*) Netto Italia. Fonte: Elaborazioni CSC su dati Datastream
Fig. 36 - TASSI DI CAMBIO EFFETTIVI REALI SUI PREZZI ALLA PRODUZIONE DELL’ITALIA(Numeri indice: 1995=100) Fonte: Elaborazioni CSC su dati Datastream
Fig. 37 - TASSI DI CAMBIO EFFETTIVI REALI SUL CLUP DELL’ITALIA(Numeri indice: 1995=100) Fonte: Elaborazioni CSC su dati BLS e Datastream
Fig. 38 - ESPORTAZIONI DI BENI IN VALORE (*) - CONFRONTI FRA AREE(Numeri indice: 1990=100) (*) In milioni di dollari. Fonte: Elaborazioni CSC su dati FMI
Fig. 39 - ESPORTAZIONI DI BENI IN VOLUME (*) - CONFRONTI FRA AREE(Numeri indice: 1990=100) (*) In milioni di dollari. Fonte: Elaborazioni CSC su dati FMI
Fig. 40 - ESPORTAZIONI DI BENI: QUOTE DI MERCATO DELL’ITALIA SULLE ESPORTAZIONI MONDIALI Fonte: Elaborazioni CSC su dati FMI
Fig. 41 - ESPORTAZIONI DI BENI E SERVIZI: QUOTE DI MERCATO DELL’ITALIA SULLE ESPORTAZIONI DELL’AREA DELL’EURO(A prezzi 1995) Primo trimestre per il 2000. Fonte: Elaborazioni CSC su dati ISTAT, Eurostat