Download
1 / 14
140 likes | 286 Views
Analysis of Key Employee Demographic and Special Relationships Impacting Commutes . Overview. Program background and drivers Service area Employee density Distance analysis Demographic trends Route profile Proposed decision making criteria Q&A. Genentech in South San Francisco.

E N D
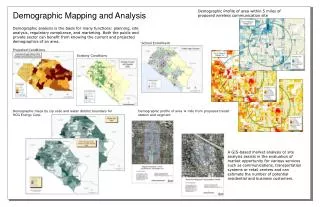
Analysis of Key Employee Demographic and Special Relationships Impacting Commutes
Overview • Program background and drivers • Service area • Employee density • Distance analysis • Demographic trends • Route profile • Proposed decision making criteria • Q&A
Genentech in South San Francisco • Founded in 1976, Genentech invented the Biotechnology industry • 200 acre campus in South San Francisco, CA • 4.5 million square feet of office, lab and manufacturing space • Average daily population of ~10,000 employees • Most employees live in San Francisco and San Mateo counties
Business Drivers • Recruitment, Retention, Quality of Life • Productivity Enabler • Carbon Footprint • Parking, Master Plan and Capital Expense
3,200 out of 9,500 employees are active gRide users/members $2-4 per day cash incentive $4 per rider per day for drivers $120 Transit and Vanpool Subsidy 16 GenenBus routes - 30 Motorcoaches - Over 600,000 riders in 2010 Over 65,000 web page views per month B-Cycle BikeShare Hertz Connect CarShare gRide Today
Service Area • 30 GenenBuses serving 16 direct and transit shuttle routes with over 3,000 riders per day • Direct routes focus on areas with poor or no public transportation, high density neighborhoods in San Francisco, long, arduous commutes, and expensive bridge tolls
Employee density • Density focused in San Francisco and San Mateo counties • 75% of employees live within 20 miles of SSF campus
Overall participation by route • Routes with high utilization tend to be in San Francisco and the East Bay • Non-participants tend to live close to the SSF campus and have very short commutes
Commute time distance comparison • Commute time is similar for participants and non-participants • Drive distance follows a similar pattern for participants and non-participants
Tapestry segmentation • Tapestry segmentation is very similar for both groups • Non-riders do not share International Marketplace, Pleasant-Ville, or Top Rung • Riders do not share Enterprising Professionals, Suburban Splendor, or Boomburbs
Cupertino route analysis • Drive time average 77 min. • Average drive distance 31 miles • Employees on this route tend to be have more IT related jobs • Active users tend to be clustered • Both users and non users share the same top five tapestry groups
Decision making criteria • Drive time • Drive distance • Special corridor conditions • Segmentation attributes • Wild cards