Download
1 / 28
280 likes | 454 Views
Demographic Analysis of Henderson County. Prepared by Jason Bremner for Children and Family Resource Center. Goals. Develop a demographic profile of Henderson County for the introductory section of the United Agenda for Children report.

E N D
Demographic Analysis of Henderson County Prepared by Jason Bremner for Children and Family Resource Center
Goals • Develop a demographic profile of Henderson County for the introductory section of the United Agenda for Children report. • Provide demographic and socio-economic data to the United Agenda for Children leadership group to identify a representative group of participants for the community forum in October.
Sources of Data • All data were acquired from public access U.S. Census Bureau data: www.census.gov • Census 2000 • American Community Survey 2005 (ACS) • A new nationwide survey designed to provide communities with a fresh look at how they are changing. • Population Estimates 2006
Census vs. Sample • Census – a count of all individuals in a chosen area. • Measures are true values. • Sample- selection of a representative group of individuals. • Estimates of measures are made based on the sample. All measures based on a sample will have an element of error (confidence intervals).
Sample Data • American Community Survey 2005 • A sample of ~ 3 million households • Census 2000 • Data for certain characteristics (e.g. income) are based on a sample of the original census data. • Measures from sample must be interpreted with some caution.
Total Population (July, 2006) 99,033 Population Change (2000-2006) 9,829 Percent Change in Population (2000-2006) 11.00% Annual Population Growth Rate (2005-2006) 1.9% Henderson CountyTotal Population and Rates of Change Table 1. Population Estimates and Rates of Change for Henderson County Source: U.S. Census Bureau Population Estimates
Age Group 1990 2000 2005 0-17 14,577 18,552 20,609 18-64 39,569 51,280 55,231 65+ 15,139 19,341 19,541 Total 69,285 89,173 95,381 Age Distribution Table 2. The number of Henderson County Residents in Select Age Groups Sources: United States Census Bureau, Census 1990, Census 2000, ACS 2005
Age Group 1990 2000 2005 Rate of Change (%) 2000-2005 0-17 21.04 20.80 21.61 11.09 18-64 57.11 57.51 57.91 7.70 65+ 21.85 21.69 20.49 1.03 Total 100.00 100.00 100.00 Age Composition Table 3. Age Composition of the Henderson County Population and Rates of Change (%) Sources: United States Census Bureau, Census 1990, Census 2000, ACS 2005
Percent Total population 95,381 100 Not Hispanic or Latino White alone 83,122 87.15 Black or African American alone 3,374 3.54 American Indian and Alaska Native alone 135 0.14 Asian alone 282 0.30 Some other race alone 252 0.26 Two or more races 496 0.52 Hispanic or Latino (of any race) 7,720 8.09 Racial/Ethnic Composition Table 4. The Racial/Ethnic Composition of the Henderson County Population. Source: United States Census Bureau, ACS 2005
Hispanic/Latino Population 2005 7,720 Hispanic/Latino Population 2000 4,880 Growth in Hispanic/Latino Population 2,840 Percent Growth in Hispanic/Latino Population 58.20 Growth in the Hispanic/Latino Population Table 5. Change in the Hispanic/Latino Population between 2000 and 2005. Sources: United States Census Bureau, Census 2000, ACS 2005
2005 2000 Under 5 years 19.31 12.00 5 to 9 years 15.77 8.03 10 to 14 years 9.69 6.88 15 to 17 years 4.67 7.75 Growth in the Hispanic/Latino Child Population Table 6. The Percentage of Children in Young Age Groups that are Hispanic/Latino. Sources: United States Census Bureau, Census 2000, ACS 2005
Income and Benefits 2005 2000 Less than $25,000 32.59 29.84 $25,000 to $74,999 49.23 53.95 75,000 or more 18.18 16.21 Median household income (dollars) 37,031 38,109 Household Income Table 7. Distribution of Household Income in Henderson County. Sources: United States Census Bureau, ACS 2005
Race Median Household Income (Dollars) White 39,044 Black 19,273 Hispanic/Latino 28,389 Racial/Ethnic Comparison of Income Table 8. Median Income by Race for Henderson County Source: United States Census Bureau, Census 2000
2005 2000 Total No. of Children 20,609 18,552 Children in Poverty 4,659 2,719 Percent of Children in Poverty 22.6 14.7 Percent of People in Poverty 12.1 9.7 Poverty Status Table 9. Poverty Status in Henderson County for 2000 and 2005 Source: United States Census Bureau, ACS 2005
Henderson County Race Persons Below Poverty Line Total Population Percentage of the Race/Ethnicity in Poverty White 6,782 80,885 8.4 Black 829 2,436 34.0 Hispanic/Latino 1,053 4,830 21.8 Poverty Status by Race Table 10. Poverty Status by Race in Henderson County. Source: United States Census Bureau, Census 2000
Percent Households with one or more people under 18 years: 10,589 100.00 Family households: 10,482 Married-couple family 7,794 73.60 Other family: 2,688 Male householder, no wife present 703 6.64 Female householder, no husband present 1,985 18.75 Non-family households: 107 1.01 Family Structure Table 11.Family Structure of Households with Children Under 18 Years in Henderson County Source: U.S. Census Bureau. Census 2000.
Family households: White Black Hispanic/Latino Married-couple family: 84.57 48.40 71.13 Other family: 15.43 51.60 28.87 100.00 100.00 100.00 Family Structure by Race Table 12. Family Structure of Households with Children Under 18 Years by Race Source: U.S. Census Bureau. Census 2000.
Persons Percent Blue Ridge township 8,487 9.52 Clear Creek township 4,616 5.18 Crab Creek township 4,109 4.61 Edneyville township 3,454 3.87 Green River township 3,948 4.43 Hendersonville township 43,697 49.00 Hoopers Creek township 9,994 11.21 Mills River township 10,868 12.19 Geographic Distribution Table 13. Geographic Distribution of the Henderson County Population by Township. Source: United States Census Bureau, Census 2000
Henderson County, North Carolina Total: 89,173 100.00 Urban: 47,398 53.15 Rural 41,775 46.85 Urban/Rural Composition Table 14. Urban/Rural Composition of the Henderson County Population. Source: United States Census Bureau, Census 2000
Blue Ridge Clear Creek Crab Creek Edney-ville Green River Henderso-nville Hoope-rs Creek Mills River Total: 8,487 4,616 4,109 3,454 3,948 43,697 9,994 10,868 Urban: 823 1,730 0 0 0 37,931 6,655 259 Rural 7,664 2,886 4,109 3,454 3,948 5,766 3,339 10,609 Urban – Rural Composition of the Townships Table 15. Urban/Rural Composition of Henderson County Population by Township. Source: United States Census Bureau, Census 2000
Blue Ridge Clear Creek Crab Creek Edneyville Green River Hendersonville Hoopers Creek Mills River Total: 100.0 100.0 100.0 100.0 100.0 100.0 100.0 100.0 Not Hispanic or Latino: White alone 87.6 91.1 93.3 88.5 96.0 87.6 90.8 96.2 Black alone 0.6 3.0 0.8 1.9 0.2 4.3 3.7 1.2 Hispanic or Latino 10.1 4.2 4.8 8.4 3.1 6.3 2.9 1.5 Racial/Ethnic Composition by Township Table 16. Racial/Ethnic Comparison of the Townships of Henderson County. Source: United States Census Bureau, Census 2000
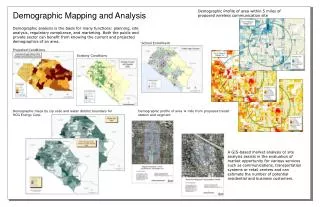
Racial Composition by Township Figure 1. Racial/Ethnic Composition of the Townships of Henderson County. Source: United States Census Bureau, Census 2000
Poverty Status Figure 2. The Percent of Each Township’s Population Living Below the Poverty Level. Source: United States Census Bureau, Census 2000
Number of Children Living in Poverty Percentage of the Henderson County children in poverty Living in the Township Blue Ridge 221 13.06 Clear Creek 149 8.81 Crab Creek 120 7.09 Edneyville 79 4.67 Green River 23 1.36 Hendersonville 818 48.35 Hoopers Creek 162 9.57 Mills River 120 7.09 County 1692 100.00 Where do Children in Poverty Live? Table 17. The Location of Children Living Below the Poverty Level for Henderson County. Source: United States Census Bureau, Census 2000
Percent 3 and 4 year olds not enrolled Percent 5-17 year olds not enrolled Blue Ridge 66.10 3.68 Clear Creek 47.30 3.86 Crab Creek 72.53 5.61 Edneyville 66.28 5.21 Green River 68.18 2.81 Hendersonville 41.01 3.92 Hoopers Creek 51.88 3.83 Mills River 39.15 1.23 County 50.63 3.62 School Enrollment Table 18. The Percent of Children Enrolled in Schools in Henderson County by Township. Source: United States Census Bureau, Census 2000
Selecting a Sample for the Forum • Choose Important Characteristics Table 19. Mecklenburg Co Comparison of Demographics with Attendees of the Forum.
Characteristics of Interest • Proposed Starting Points • Township • Race/Ethnicity • Additional Recruitment • Income/Poverty Status • Family Structure