Download
1 / 36
360 likes | 387 Views
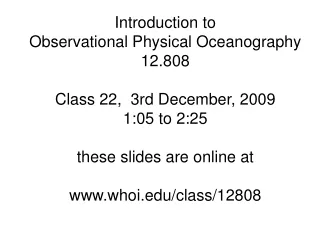
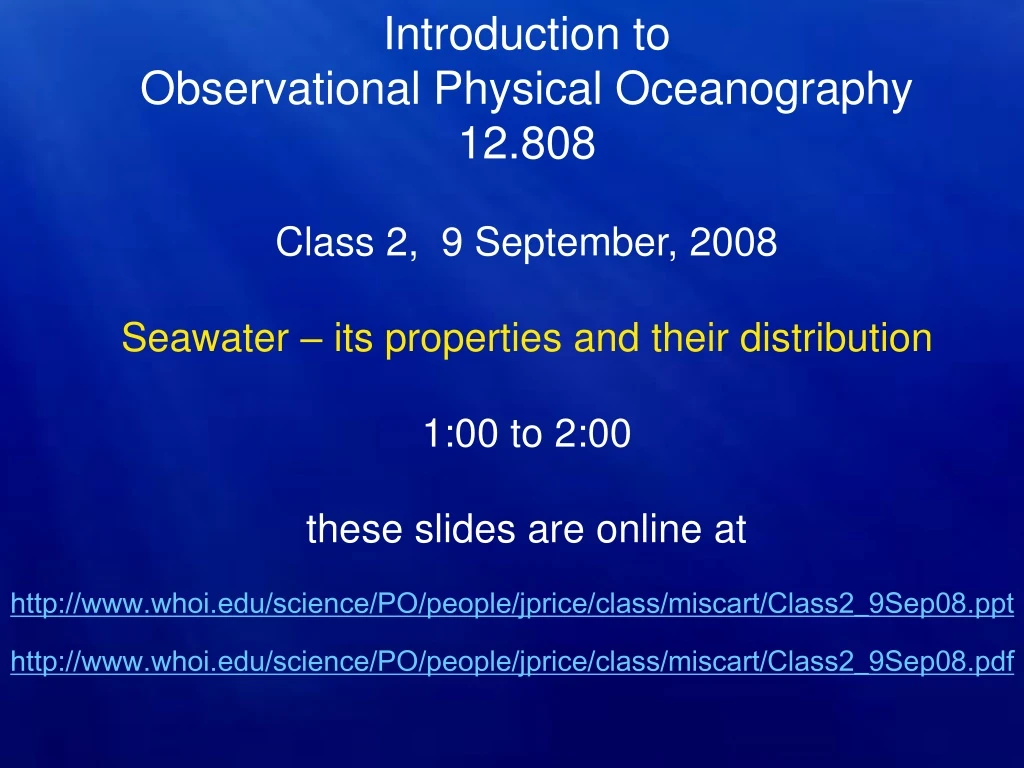
Introduction to Observational Physical Oceanography 12.808 Class 2, 9 September, 2008 Seawater – its properties and their distribution 1:00 to 2:00 these slides are online at http://www.whoi.edu/science/PO/people/jprice/class/miscart/Class2_9Sep08.ppt

E N D
Introduction to Observational Physical Oceanography 12.808 Class 2, 9 September, 2008 Seawater – its properties and their distribution 1:00 to 2:00 these slides are online at http://www.whoi.edu/science/PO/people/jprice/class/miscart/Class2_9Sep08.ppt http://www.whoi.edu/science/PO/people/jprice/class/miscart/Class2_9Sep08.pdf
Temperature and Salinity in Sermilik Fjord September 2nd 2008
Class 2 • Seawater: its properties and their distribution • temperature • salinity • pressure • density (equation of state) • potential temperature/density • static stability • T/S diagrams • water types and masses Class 2 Class 3 Class 4 Reading: Knauss 2005, Ch 1 and 2.
Annual Mean Sea Surface Temperature, SST made from about 5 million hydro casts
Q is strongly dependent upon latitude; E is much less so from Bryden, 2001
Deviations from latitudinal bands due to ocean circulation Infrared Radiometry: high horizontal coverage, accuracy of ~0.5 C. Surface only.
Why does temperature matter ? • Influences the chemistry and biology of the ocean • Regulates the phase transitions (water vapour, sea-ice) • Regulates the exchange of heat with the atmosphere • Tends to dominate the density of seawater • Impact on sea-level
Temperature and Heat Consider a column of ocean of area A and thickness h H= Heat Content = ρ Cp T A h Units of heat content = Joules (J) area = A Cp - specific heat capacity of sea water ~ 4000 J/(kg C) ρ - density ~ 1025 kg/m3 h
Temperature and Heat Consider a column of ocean of area A and thickness h H= Heat Content = ρ Cp T A h Units of heat content = Joules (J) area = A Cp - specific heat capacity of sea water ~ 4000 J/(kg C) ρ - density ~ 1025 kg/m3 h Temperature units – degree Celsius (ºC or C) T in ºK (or Kelvin) = T in ºC – 273.15
Changes in Heat Content and Temperature Consider a box at the sea-surface - its heat content can change due to transfer of heat through its `ocean walls’ or through exchange of heat with atmosphere above it - assuming no exchange through the ‘ocean walls’: area = A Q, a heat flux; Q = [ Watts m-2 ] = [ J s-1 m-2] Δ H = Δ (h A ρ Cp T) = A Q Δt Δ T = Q /(Cp h ρ) Δt dT/dt = Q/(Cp h r) h
Time series of global annual heat content change of the upper 700m IPCC 2007 p. 390
Linear trend 1955-2003 of change in heat content per unit area of the upper 700m (W/m2) – contour interval is 0.25 W/m2 IPCC 2007 p. 391
Measuring temperature (sub-surface) • you need to go, or send an instrument, at the location • you need an instrument 1880 - 1970 Reversing Thermometers (expansion/contraction of a fluid as it warms/cools) photo from SEA accurate to ~ 0.01 C
Measuring temperature (sub-surface) • you need to go, or send an instrument, at the location • you need an instrument From ~ 1960 Thermistor: use the relation between the conductivity of metals/semiconductors and temperature. Accuracy 0.001 C photo by R. Pickart
a typical vertical profile of temperature Temperature, C surface mixed-layer Depth, m seasonal thermocline main thermocline deep or abyssal layer Knauss, 1997
a north to south section (z, y) of Potential Temperature, C 20 10 0 -1 C < T < 30 C at the surface T < 3 C for depths > 1500 m e-woce gallery
N Atlantic Pacific e-woce gallery
Salinity: Measure of the amount of dissolved salts present in seawater (note while the amount varies the relative concentrations are almost constant throughout the ocean). From Seawater, Its Composition ..
Distribution of sea surface salinity Salinity variations are mainly due to fresh water subtracted or added at the surface by evaporation and precipitation, E - P, and continental runoff. from Seawater: Its Composition ..
Why does salinity matter? • Influence on density (dynamics, stability) • Some influence on life in the ocean • (especially in extreme environments such as estuaries)
N North Atlantic
Atlantic 35.2 37.0 34.5 34.95 34.75 Pacific 33.0 35.0 34.5 34.65 34.75 (color scale is different)
How do we measure salinity: Historically: fresh water was evaporated to determine the mass of the salts (slow, inaccurate) More Recently: titrate to find the amount of chlorine (labor intensive and expensive) Current: Measure conductivity and use the relation between S and the conductivity of seawater, removing the effect of T. Carefully calibrated CTDs can achieve accuracy of about 0.002. Salinity has non-dimensional units e.g., S = 36.4 , but it is not unusual to see 36.4 psu (practical salinity units).
How does salinity change? Changes in salinity are primarily governed by the addition/removal of fresh water instead of the addition/removal of salt Fresh water changes are primarily due to 1) E-P, evaporation minus precipitation, 2) sea-ice formation and melt, 3) river-run off and glacial melt Fresh water addition/removal is expressed as a: Ffw = volume flux [volume/(time area)] = [length/time]. E nonzero means water loss P nonzero means water gain E – P can have either sign; E - P > 0 is an excess of evaporation significant values are 1 m/year h
How does salinity change? The addition/removal of fresh water will change the volume (i.e. the thickness h, assuming A is constant) dh/dt = Ffw But the amount of salt must be conserved: d(hS)/dt = S dh/dt + h dS/dt = 0, or dS/dt = -(S/h)dh/dt = -(S/h) Ffw h For example – if Ffw = - (E-P) Net Evaporation will cause an increase in salinity, Net Precipitation will cause a decrease in salinity.
IPCC 2007 – p. 387 Salinity Difference between mean 1985-1999 minus 1955-1969 IPCC 2007 – p. 395 (redrawn from Curry et al. 2003)
The first homework project. • Assuming the area of the ocean of 361 million square kilometers and given the global heat content change curve from the IPCC report, what is the associated mean global temperature change of the upper 700m? • How large would the net mean surface flux over the ocean have to be to induce this change? • Given the global ocean’s average salinity of 35, how would it change if all of the Greenland Ice Sheet melted?